Fig. C.3.
Download original image
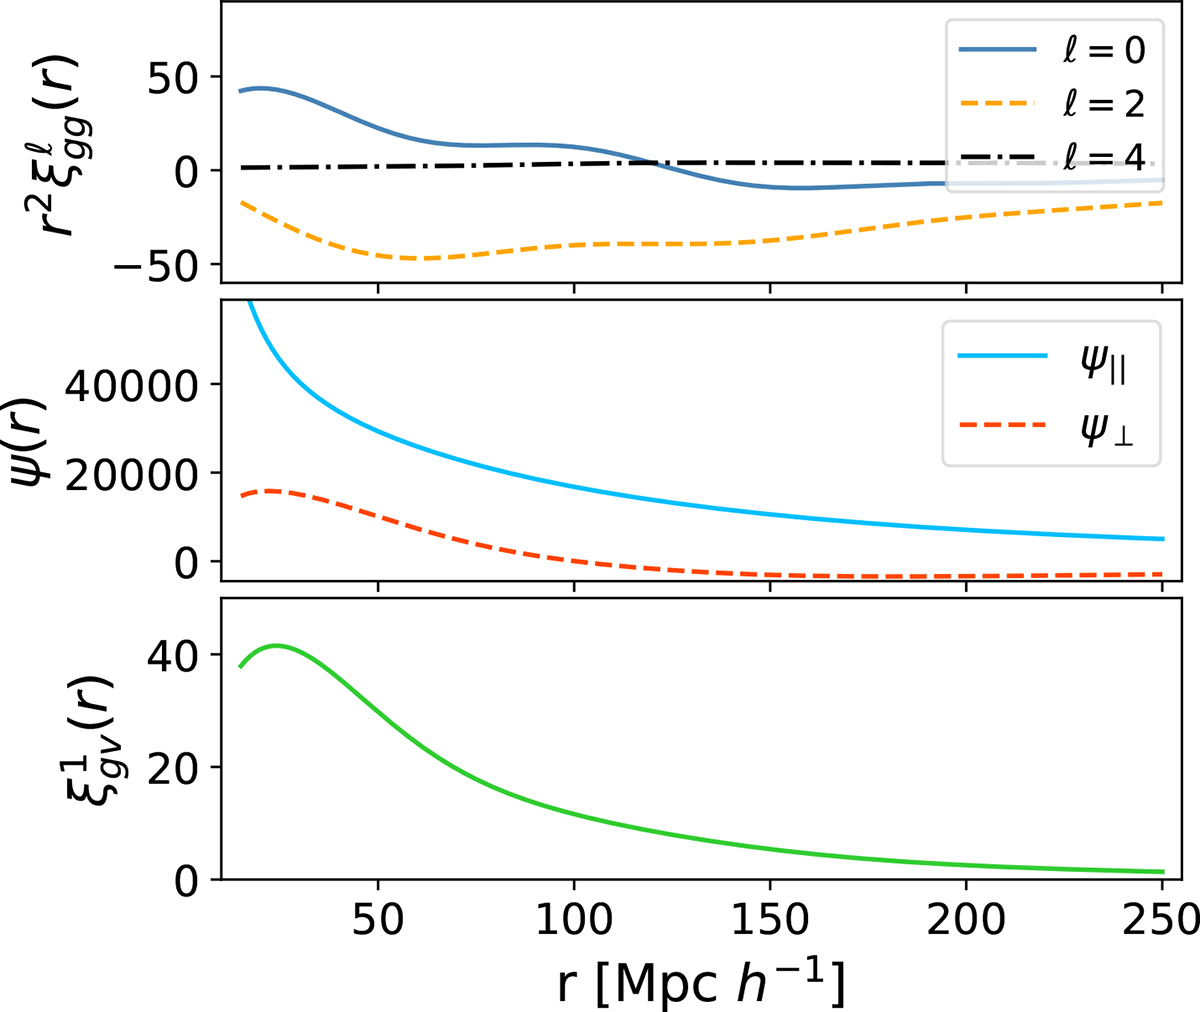
Two-point correlation function models are derived from the power spectrum models introduced in Sect. 4, using the parameter values listed in Table 2. The top panel illustrates the galaxy auto-two-point correlation function ![]() , the middle panel presents the monopole of the galaxy auto-velocity correlation function Ψ, and the bottom panel displays the dipole component of the galaxy-velocity cross-correlation function
, the middle panel presents the monopole of the galaxy auto-velocity correlation function Ψ, and the bottom panel displays the dipole component of the galaxy-velocity cross-correlation function ![]() .
.
Current usage metrics show cumulative count of Article Views (full-text article views including HTML views, PDF and ePub downloads, according to the available data) and Abstracts Views on Vision4Press platform.
Data correspond to usage on the plateform after 2015. The current usage metrics is available 48-96 hours after online publication and is updated daily on week days.
Initial download of the metrics may take a while.