Fig. 2.
Download original image
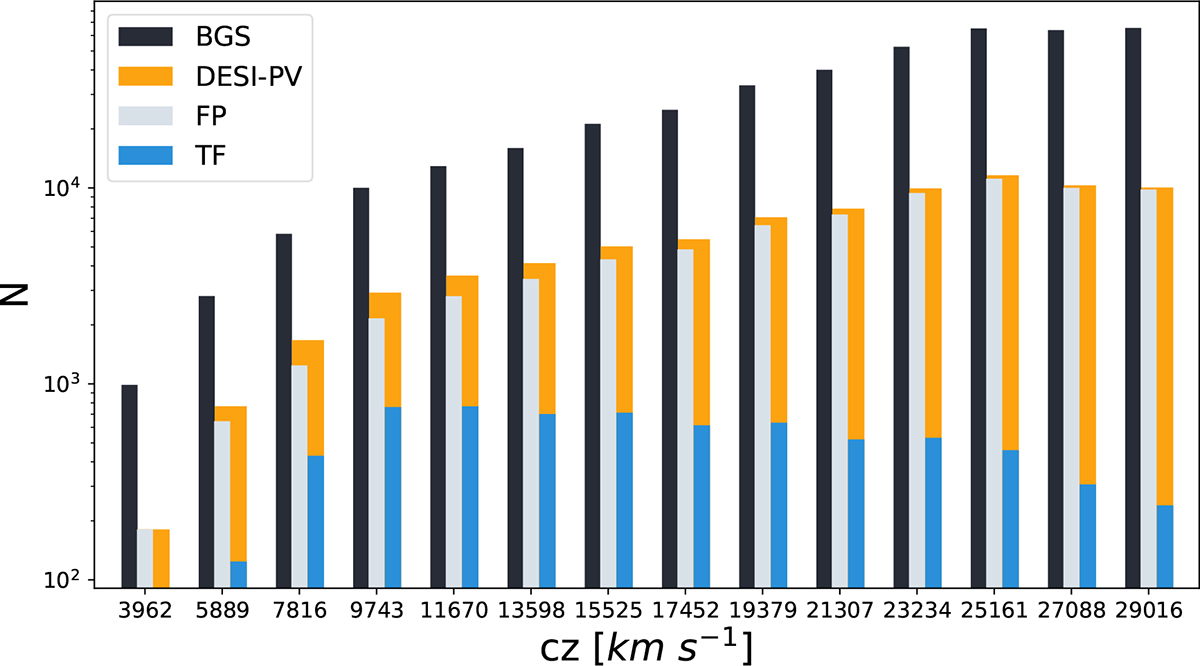
Redshift distribution of the galaxies employed in this paper. The y axis is presented on logarithmic scales to enhance the clarity of the data. The black bars depict the redshift distribution of the BGS galaxies, the grey bars delineate the redshift distribution of FP galaxies, and the blue bars illustrate the redshift distribution of TF galaxies. Additionally, the yellow bars represent the redshift distribution of the entire DESI-PV sample, which constitutes a combination of FP and TF galaxies.
Current usage metrics show cumulative count of Article Views (full-text article views including HTML views, PDF and ePub downloads, according to the available data) and Abstracts Views on Vision4Press platform.
Data correspond to usage on the plateform after 2015. The current usage metrics is available 48-96 hours after online publication and is updated daily on week days.
Initial download of the metrics may take a while.