Fig. 3.
Download original image
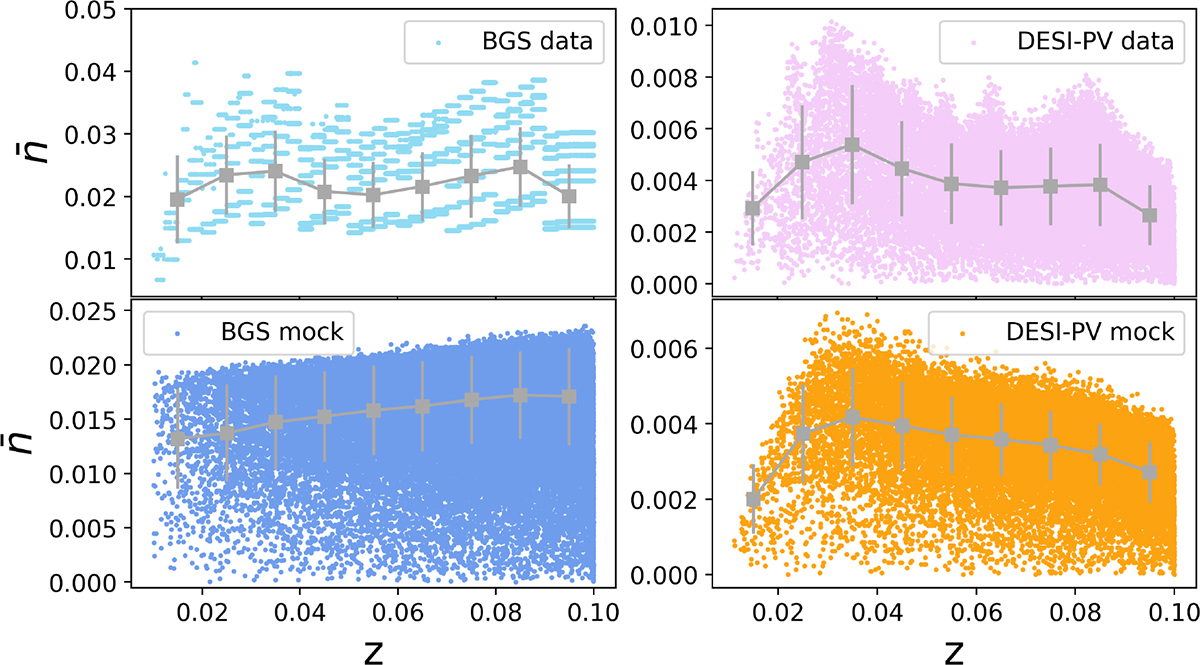
Galaxy mean number density, denoted as ![]() , as a function of redshift, z, for both the BGS and DESI-PV data and their corresponding mocks. Notably, the data points are derived from their respective random catalogues to ensure a smooth representation. The grey square with error bar represents the mean value and standard deviation of the data points within each redshift bin.
, as a function of redshift, z, for both the BGS and DESI-PV data and their corresponding mocks. Notably, the data points are derived from their respective random catalogues to ensure a smooth representation. The grey square with error bar represents the mean value and standard deviation of the data points within each redshift bin.
Current usage metrics show cumulative count of Article Views (full-text article views including HTML views, PDF and ePub downloads, according to the available data) and Abstracts Views on Vision4Press platform.
Data correspond to usage on the plateform after 2015. The current usage metrics is available 48-96 hours after online publication and is updated daily on week days.
Initial download of the metrics may take a while.