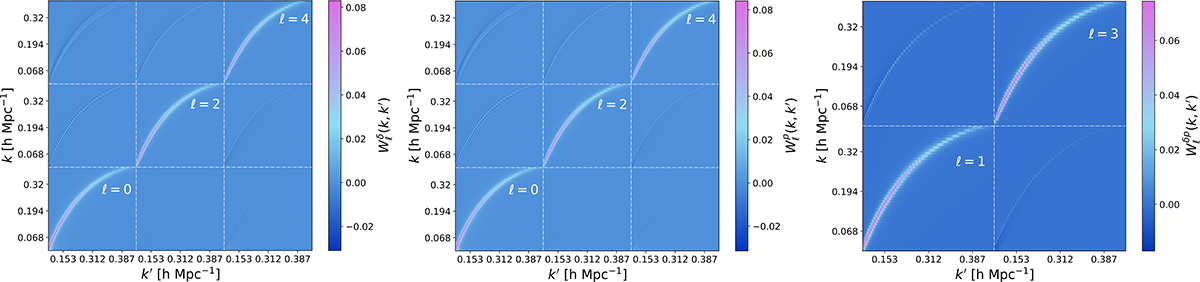
Fig. 4.
Download original image
Window function convolution matrix. The horizontal axis is presented on logarithmic scales to enhance the clarity of the data. The left panel displays the convolution matrix for the density power spectrum of the BGS data. The middle panel illustrates the convolution matrix for the momentum power spectrum of the DESI-PV data. The right panel exhibits the convolution matrix for the cross power spectrum between the BGS and DESI-PV data.
Current usage metrics show cumulative count of Article Views (full-text article views including HTML views, PDF and ePub downloads, according to the available data) and Abstracts Views on Vision4Press platform.
Data correspond to usage on the plateform after 2015. The current usage metrics is available 48-96 hours after online publication and is updated daily on week days.
Initial download of the metrics may take a while.