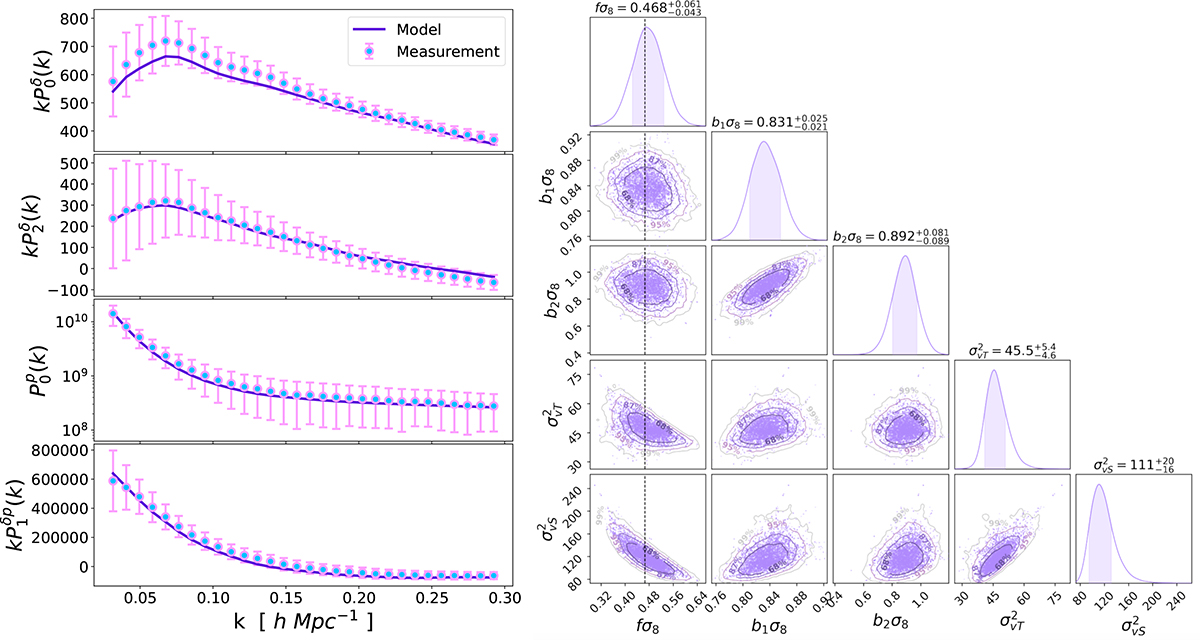
Fig. 6.
Download original image
Power spectrum and parameter fitting outcomes from the BGS and DESI-PV mocks. In the left panels, the filled circles represent the averaged measurements of the density monopole, density quadrupole, momentum monopole, and cross dipole power spectrum, respectively, across 675 mocks. The error bars reflect the uncertainty associated with a single realization. The fitted model power spectrum is overlaid as curves. On the right, the marginalized histograms and two-dimensional contours of the MCMC samples for the cosmological parameters are shown, with the MCMC fit results annotated at the top of each histogram (or see Table 2). The 2D contours delineate the 1, 1.5, 2, and 2.5σ confidence levels, while the shaded regions in the histograms indicate the 1σ confidence interval. The vertical dashed line marks the fiducial value fσ8 = 0.466.
Current usage metrics show cumulative count of Article Views (full-text article views including HTML views, PDF and ePub downloads, according to the available data) and Abstracts Views on Vision4Press platform.
Data correspond to usage on the plateform after 2015. The current usage metrics is available 48-96 hours after online publication and is updated daily on week days.
Initial download of the metrics may take a while.