| Issue |
A&A
Volume 703, November 2025
|
|
|---|---|---|
| Article Number | A296 | |
| Number of page(s) | 13 | |
| Section | Stellar atmospheres | |
| DOI | https://doi.org/10.1051/0004-6361/202557263 | |
| Published online | 26 November 2025 | |
Understanding the origin of palladium in metal-poor stars based on the non-local thermodynamic equilibrium analysis of Pd I lines★
1
Institute of Astronomy, Russian Academy of Sciences,
119017
Moscow,
Russia
2
M. V. Lomonosov Moscow State University,
Kolmogorova st. 1,
119991
Moscow,
Russia
★★ Corresponding author: This email address is being protected from spambots. You need JavaScript enabled to view it.
Received:
16
September
2025
Accepted:
7
October
2025
Abstract
Context. Palladium is a poorly observed neutron-capture element. Abundance determinations for stellar samples covering a broad metallicity range are needed for a better understanding of the mechanisms of Pd synthesis during the Galaxy evolution.
Aims. We obtain accurate abundances of Pd for the Sun and a sample of metal-poor stars based on the non-local thermodynamic equilibrium (NLTE) line formation for Pd I.
Methods. We present a new comprehensive model atom of PdI. We derived the abundances of Pd, Sr, Ba, and Eu for 48 stars from the NLTE analyses of high-resolution spectra with a high signal-to-noise ratio provided by the ESO archives. The results we obtained are based on the synthetic spectrum method with one-dimensional (1D MARCS) model atmospheres.
Results. NLTE leads to weakened Pd I lines and positive NLTE abundance corrections growing from 0.2 dex for the solar lines up to 0.8 dex for the lines in the most luminous star of the sample. Depending on the treatment of inelastic collisions with hydrogen atoms, the solar NLTE abundance is log ε⊙,Pd = 1.61±0.02 to 1.70±0.02 and agrees within the error bars with the meteoritic abundance log εmet,Pd = 1.65. NLTE largely removes the discrepancies in the LTE abundances between giant and dwarf stars of similar metallicities. Palladium is tightly correlated with Eu in the −1.71 ≤ [Fe/H] ≤ −0.56 range, which indicates r- and s-process contributions to the Pd synthesis of approximately 70% and 30%, respectively. Palladium is of pure r-process origin in our two r-II stars, and a dominant contribution of the r-process to the Pd abundances is found for another two very metal-poor (VMP; [Fe/H] < −2) stars. The two VMP stars are strongly enhanced with Sr relative to Ba and Eu and also have a higher Pd. We propose that the source of the additional Sr and Pd in these stars are VMP fast-rotating massive stars.
Conclusions. NLTE is essential for obtaining the observational constraints to future models of the Galactic Pd evolution.
Key words: line: formation / stars: abundances / stars: atmospheres / Galaxy: abundances
Based on observations made with the telescopes of the European Southern Observatory.
© The Authors 2025
 Open Access article, published by EDP Sciences, under the terms of the Creative Commons Attribution License (https://creativecommons.org/licenses/by/4.0), which permits unrestricted use, distribution, and reproduction in any medium, provided the original work is properly cited.
This article is published in open access under the Subscribe to Open model. This email address is being protected from spambots. You need JavaScript enabled to view it. to support open access publication.
1 Introduction
Chemical elements beyond the Fe group are produced in neutron capture (n-capture) nuclear reactions, from the slow (s-) process and the rapid (r-) process in differing proportions for different isotopes (Burbidge et al. 1957). The s-process operates at neutron number densities of Nn ~ 106−107 cm−3 and is represented by the main and weak s-process components (see Käppeler et al. 2011, and references therein). The former takes place in intermediate-mass (0.9-8 M⊙) stars during their thermal pulses on the asymptotic giant branch (AGB) phase and produces heavy nuclei from gallium (Ga, Z = 31) up to bismuth (Bi, Z = 83). The weak s-process component is associated with the He-burning cores of massive (~20 M⊙) stars and contributes to production of heavy nuclei with an atomic mass of up to A ~ 90. The r-process runs at extremely high neutron densities of Nn > 1024 cm−3, which can be reached in explosions of massive (>8 M⊙) stars, such as neutron star mergers and mag-netorotational supernovae (see Cowan et al. 2021, for a review of the astrophysical sites for the r-process). The neutron capture chain of the r-process can proceed beyond Bi.
Based on the dominant contribution of either the s- or r-process to their solar abundances, the chemical elements are often referred to as the s- or r-process elements. For example, Sr and Ba are s-process elements because according to calculations of Prantzos et al. (2020), the s-nuclei constitute about 92% and 88% of the solar strontium and barium. Europium is an r-process element because the s-nuclei constitute only as little as 5% of the solar europium. This paper focuses on palladium. According to Prantzos et al. (2020), solar palladium was produced nearly equally in the s- (45.5%) and r-process. For each chemical element, the relative contribution of the r- and s-process to its synthesis varied during the Galaxy history because the lifetimes of the r- and s-nucleus sources are different. The galactic chemical evolution models need to be verified with observations of the n-capture elements in stellar samples covering a broad metallicity range. A plethora of data is available in the literature on the best-observed elements in our Galaxy, such as Sr, Y, Zr, Ba, La, and Eu (for example McWilliam 1998; Mashonkina et al. 2003; François et al. 2007; Roederer et al. 2014; Lombardo et al. 2025), and in the Galaxy satellites (for example Frebel et al. 2010; Gilmore et al. 2013; Mashonkina et al. 2017b; Hill et al. 2019; Reggiani et al. 2021).
Palladium is a poorly observed n-capture element in metalpoor (MP, [Fe/H]1 < − 1) stars. With a nuclear charge of Z = 46 and a number of neutrons (Nn = 58-60, 62, and 64 for the most abundant isotopes) that is far from the magic numbers Nn = 50, 82, and 126, Pd has a lower abundance than Sr and Ba, for example, and it is represented in stellar spectra by a very few lines of Pd I that are located in the blue range, at λ < 3700 Å. Palladium abundances were measured for strongly r-process enhanced ([Eu/Fe] > 1, [Ba/Eu] < 0) stars (Sneden et al. 2003; Hill et al. 2002, 2017; Hayek et al. 2009), which are referred to as r-II stars, according to the definition of Christlieb et al. (2004). The first abundance determinations for Pd in a large sample of MP stars were reported by Hansen et al. (2012), who concluded that the Galactic trends of elemental ratios involving Pd suggest a contribution to the Pd production from a second or weak r-process that differs from the classical (main) r-process in the neutron number densities, neutron-to-seed ratios, entropies, and electron abundances. The statistics of stellar Pd measurements was increased by Peterson (2013); Wu et al. (2015), and Aoki et al. (2017).
The palladium abundance determinations made so far were all based on the assumption of local thermodynamic equilibrium (LTE). Hansen et al. (2012) found an abundance difference between dwarfs and giants of similar metallicity and suggested that the departures from LTE might be a possible explanation. With its ionization energy χ = 8.337 eV, palladium is indeed ionized in physical conditions that are typical for the atmospheres of MP stars and can be subject to ultraviolet (UV) overionization caused by superthermal radiation of a nonlocal origin below the thresholds of the Pd I low-excitation levels. Non-local thermodynamic equilibrium (NLTE) calculations for lines of Pd I have not been performed so far.
We construct the model atom of palladium and determine, for the first time, the NLTE abundances of Pd in the Sun and the sample of 48 stars covering the −2.92 ≤ [Fe/H] ≤ −0.56 metal-licity range. The high-resolution spectra of the selected stars are available in the archives of the European Southern Observatory (ESO). We also determine the NLTE abundances of Sr, Ba, and Eu that are the best representatives of the elements produced effectively in the weak s-process, the main s-process, and the r-process, respectively. The Galactic trends of the elemental ratios of Pd, Sr, Ba, and Eu are expected to play a key role in understanding the nucleosynthetic origin of palladium during the Galaxy evolution.
The paper is organized as follows. Section 2 introduces the model atom for palladium. In Sect. 3, we determine the LTE and NLTE abundances from the solar Pd I lines. Section 4 describes our stellar sample, the sources of the observed spectra, and the determination of stellar atmospheric parameters. The NLTE abundances of Pd, Sr, Ba, and Eu are derived in Sect. 5, and we discuss the Galactic abundance trends we obtain in Sect. 6. Our conclusions are given in Sect. 7.
2 NLTE calculations for Pd I
2.1 Model atom for palladium
2.1.1 Energy levels
The atomic model was built using 143 levels of neutral palladium, Pd I, from the database of the National Institute of Standards and Technology (NIST)2 (Kramida et al. 2024) and based on the 383 levels predicted in calculations of the atomic structure (Kurucz 2017, files c4600e.log and c4600o.log from 2017 September 03), which were not detected in laboratory experiments so far. The high-excitation levels provide a close collisional coupling to the first-ionization stage, Pd II, and thus play an important role in the statistical equilibrium (SE) of palladium. The levels with a low energy separation (<250 cm−1 ≃ 0.03 eV) and of the same parity were combined into superlevels. The superlevels all lie above the excitation energy Eexc = 7 eV and are composed predominantly from levels predicted in calculations of the Pd I atomic structure. For each superlevel, we calculated the energy from energies of individual levels and took their statistical weights into account. The final atomic model included 106 levels of Pd I.
Singly-ionized palladium is represented in the model atom by its ground state with the statistical weight g = 10. The lowest Pd II term, 4d9 2D, has two fine-splitting levels, with Eexc = 0 (J = 5/2) and Eexc = 0.4388 eV (J = 3/2), and the partition function of PdII varies from U = 7.71 to U = 10.37 when the temperature grows from 5800 K to 12 000 K. Our test calculations revealed minor changes in the departures from LTE for the lines of Pd I when g(Pd II) varies between 8 and 12.
Because the L-S coupling is violated, the quantum numbers of the total orbital angular momentum are not determined for many states of Pd I. For example, the term of the electronic configuration 4d9(2D5/2)5s is indicated in the NIST data base as 2[5/2]. In order to illustrate the Pd I model atom in Fig. 1, we used the term definitions for all levels as predicted in the calculations of the atomic structure by Kurucz (2017).
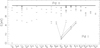 |
Fig. 1 Energy levels of Pd I, as presented in the model atom. The spectral lines we used in the Pd abundance analysis arise in the transitions that are shown as continuous lines. The term designations correspond to the calculations of the atomic structure by Kurucz (2017). |
2.1.2 Radiative transitions
For 35 bound-bound (b-b) transitions, we applied oscillator strengths based on the laboratory measurements of Xu et al. (2006). For 1951 b-b transitions, the gf-values were taken from the calculations of Kurucz (2017, file gf4600.low from 2017 September 06). The mean difference in the g f -values between Xu et al. (2006) and Kurucz (2017) is −0.03 ± 0.23 for 35 lines in common.
The photoionization cross-sections were calculated in the hydrogenic approximation using the effective principal quantum number instead of the principal quantum number. In Sect. 3, we determine the effect of variations in the photoionization cross-sections for Pd I on the final NLTE results.
2.1.3 Collisional transitions
No accurate data are available, and we therefore computed the electron-impact excitation with the semi-empirical formula of van Regemorter (1962) for the allowed transitions and adopted the effective collision strength Υ = 1 for the forbidden ones. To calculate the electron-impact ionization rates, we relied on the formula by Seaton (1962).
In the stellar parameter range of interest here, the number density of free electrons in the atmospheres is much lower than that of neutral hydrogen atoms. It is Ne/Nh ~ 10−4. The SE of any given atom should therefore be calculated by taking the level excitation and the ion formation by collisions with HI atoms into account. No accurate data are available in the literature for Pd I + HI collisions, and we calculated the excitation and ionization rates with the formulas by Steenbock & Holweger (1984), which are based on the theoretical approximation of Drawin (1969). For the forbidden transitions, we computed the H I collisional rates using the corresponding electron-impact excitation rates, as recommended by Takeda (1994):  . Here, me, mH are the masses and Ne, NH are the number densities of electrons and H I atoms. The treatment of hydrogen collisions is very approximate, and in Sects. 3 and 5.1, we therefore perform test calculations by introducing a scaling factor SH to the Drawinian rates.
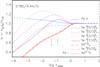 |
Fig. 2 Departure coefficients, b, for the selected levels of Pd I as a function of log τ5000 in the model atmosphere with Teff = 5780 K, log g = 4.44, and [Fe/H] = 0. The tick marks indicate the optical depth unity for the Pd I 3242 (1) and 3404 Å (2) line centers. |
2.2 Statistical equilibrium of Pd I in stellar atmospheres of different metallicities
The coupled SE and radiative transfer equations in a given atmospheric structure were solved with a modified version of the code DETAIL (Giddings 1981; Butler 1984). The revised opacity package was described by Mashonkina et al. (2011). We used the plane-parallel (1D) model atmospheres obtained by the interpolation in the MARCS3 grid (Gustafsson et al. 2008) for the given effective temperature (Teff), surface gravity (log g), and iron abundance [Fe/H].
Figure 2 displays the departure coefficients, b = nNLTE/nLTE, of the selected atomic levels in the model atmosphere with Teff = 5780 K, log g = 4.44, [Fe/H] = 0 (5780/4.44/0). Here, nNLTE and nLTE are the statistical equilibrium and thermal (Saha-Boltzmann) number densities, respectively. Palladium is strongly ionized throughout the atmosphere, with N(Pd I)/N(Pd) < 0.05. The number density of the minority species is sensitive to deviations in the intensity of the ionizing radiation from the Planck function. The superthermal radiation in the 3000-4000 Å spectral range, where the ionization thresholds of the PdI 4d9(2D5/2)5p2[5/2]°, 4d9(2D3/2)5p2[1/2]°, 4d9(2D3/2)5p2[5/2]° levels are located, leads to their overionization, and the effect is transferred to other levels via the b-b transitions. On the other hand, radiative pumping from the low-excitation even levels tends to overpopulate the odd levels 4d95p2[7/2]°, 2[3/2]°, 2[5/2]° (3F°, 3P°, 3D° in Fig. 1). The net effect is depleted populations (b < 1) of the Eexc < 4 eV levels and enhanced populations (b > 1) of the 4 eV < Eexc < 5 eV levels in the line formation layers.
A similar behavior of the departure coefficients was found in the MP models. The intensity of the UV ionizing radiation is greater there because the metal opacity is lower, however, the effect of radiative pumping is weaker because the Pd abundance is lower. As a result, all the Pd I levels have depleted populations in the line formation layers.
For all stellar atmosphere parameters we studied, NLTE leads to weakened Pd I lines because, for each line in the line formation layers, the lower level of the corresponding transition has a depleted population (blow < 1) and the line source function exceeds the Planck function because of blow < bup.
3 Solar abundance of Pd
3.1 Methods
We analyzed the five best observed and least blended lines of Pd I in the intensity spectrum of the solar disk center by Delbouille et al. (1973). They are listed in Table 1. As in our previous studies, we used the canonical solar parameters Teff = 5780 K, log g = 4.44, microturbulent velocity ξt = 0.9 km s−1 and the classical atmospheric model from the MARCS database. The Pd abundances were determined using the synthetic spectrum method, that is, by automatically fitting the theoretical to the observed spectrum. The synthetic intensity spectrum was calculated with the code SIU (Reetz 1991). Using the departure coefficients from the code DETAIL, SIU calculated the lines of Pd I including the NLTE effects, while the lines of the other elements were computed assuming LTE. The atomic line parameters for calculating the synthetic spectrum were taken from the Vienna Atomic Line Database (VALD, Ryabchikova et al. 2015). For the Pd I lines, we adopted gf -values from Xu et al. (2006). Palladium is represented in nature by six isotopes. The fraction of the only isotope with the odd atomic mass, 105Pd, constitutes 22.33% in the solar system matter (Lodders 2021). According to Engleman et al. (1998), isotopic shifts and hyperfine splitting (HFS) in the PdI levels are minor, and they were not taken into account in our calculations.
3.2 Abundances from individual PdI lines
The Pd abundances were derived under the LTE assumption and in the two NLTE line formation scenarios with a different treatment of collisions with HI atoms, namely, by applying SH = 0.1 or 1 to the Drawinian rates. The results we obtained are presented in Table 1. We describe the particular fitting procedures for the Pd I lines below.
The Pd I 3404.579 Å line is the most reliable abundance indicator. It is located in the overlapping wings of two strong blends, namely, FeI 3404.270 Å + FeI 3404.301 Å + FeI 3404.354 Å and FeI 3404.755 Å + ZrII 3404.827 Å (Fig. 3). To begin, we fit the first of these blends by allowing the Fe abundance and the macroturbulent velocity Vmac to vary. With a fixed Fe abundance, the 3404.1-3405.2 Å spectral range was fit by treating the Pd abundance and Vmac as free parameters. The Ni I 3404.588 Å line affects the derived Pd abundance very little.
The PdI 3242.700 Å line overlaps FeI 3242.619 Å and is close to the molecular OH 3242.819 Å line (Fig. 3). We adjusted the abundances of Fe and O in advance in order to reproduce the absorption in the corresponding lines.
The PdI 3609.547 Å line overlaps FeI 3609.462 Å and CrI 3609.468 Å (Fig. 3), and all the three lines lie in the wing of very strong Fe I 3608.859 Å line. In order to fit the wing of Fe I 3608.859 Å around 3609.65 Å, the Fe abundance was reduced by 0.07 dex compared to the Solar System value log εFe,met = 7.45 (Lodders 2021). We used the abundance scale where log εH = 12.
The Pd I 3690.336 Å line is blended with the much stronger VI 3690.29 Å line (Fig. 3). The blend was fit by taking the HFS components of the VI line into account and by reducing the V abundance by 0.23 dex compared to log εv,met = 3.95 (Lodders 2021).
An absorption of unknown origin in the 3516.9-3517.2 Å range, where the PdI 3516.944 Å line is located (Fig. 4), makes the abundance determination from this line uncertain. Using the local continuum level shown in Fig. 4 by the dash-dotted line, we obtained a 0.16 dex lower Pd abundance than when the continuum level is determined for an extended region from 3516.0 to 3518.5 Å.
The mean abundances and their errors σpd were calculated without Pd I 3516 and 3690 Å. Here,  is the dispersion in the single-line measurements around the mean, and N is the number of lines we measured. In both NLTE scenarios, log εPd,⊙(SH = 0.1) = 1.70±0.02 and log εPd,0(SH = 1) = 1.61 ±0.02 are consistent within the error bars with the meteoritic value log εPd,met = 1.65 ±0.02 (Lodders 2021), while the LTE abundance is lower by 0.16 dex.
Solar LTE and NLTE (two scenarios: with SH = 0.1 and 1) abundances from individual lines of Pd I.
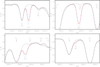 |
Fig. 3 Best NLTE (SH = 0.1) fits (continuous curves) of the Pd I lines in the intensity spectrum of the solar disk center (Delbouille et al. 1973, open circles). The obtained NLTE abundances are indicated in Table 1. In each panel, the dashed curve shows the LTE profile computed with the NLTE abundance derived from this line, and the dotted curve shows the synthetic spectrum without the contribution of the Pd I line. |
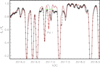 |
Fig. 4 Best fit (continuous curve) of the 3515.8-3518.5 Å range in the intensity spectrum of the solar disk center (Delbouille et al. 1973, open circles). The dotted curve shows the synthetic spectrum without the contribution of the Pd I 3516 Å line. The dash-dotted line shows the local continuum level we adopted for Pd I 3516 Å to derive the element abundance listed in Table 1. |
3.3 Uncertainties in derived NLTE abundances
Table 1 shows that the departures from LTE are similar for the investigated lines, and we chose Pd I 3404 Å in order to determine the sensitivity of the NLTE abundances to variations in the atomic model. The results of our tests are summarized in Table 2. As expected, increasing collisional rates reduce the NLTE effects. The abundance shift is larger for collisions with HI atoms (−0.09 dex) than electrons (−0.04 dex). For collisions with HI atoms with SH = 0.1, the NLTE results are not affected when the electron-impact excitation rates are lower by a factor of 10.
It seems surprising that decreasing or increasing photoionization cross sections by a factor of 10 has only a little effect on the derived NLTE abundance. This can be explained as follows. The close collisional coupling of the Pd I high-excitation levels to the ground state of Pd II and the combined photon losses in many b-b transitions to the lower excitation levels siphon an efficient flow of electrons downward and compensate efficiently for the population loss caused by increasing the photoionization rates.
3.4 Comparison with other studies
All determinations of the solar Pd abundance available in the literature were made assuming LTE. We therefore used our LTE value, log εPd⊙ (LTE) = 1.49±0.02 for comparisons. Biemont et al. (1982) applied gf-values based on their own lifetime measurements and determined log εPd = 1.68±0.04 from eight lines. Using updated gf-values and five lines of Pd I with equivalent widths (EWs) measured by Biemont et al. (1982), Xu et al. (2006) derived log εPd = 1.66±0.04. Both studies relied on the semi-empirical solar model atmosphere of Holweger & Mueller (1974, HM), which is hotter in the line formation layers than the theoretical MARCS model atmosphere. This explains why they obtained a higher Pd abundance than our LTE value. Our result is fully consistent with log εPd = 1.49 derived by Grevesse et al. (2015) using two lines of PdI and the MARCS model atmosphere. The same paper reported a higher Pd abundance, by 0.06 dex, from calculations with the three-dimensional (3D) model atmosphere. With slightly revised EWs and the same 3D model atmosphere, Asplund et al. (2021) obtained log εPd = 1.57±0.10.
The 3D-LTE abundances of solar palladium are higher than our 1D-LTE value by 0.08 dex, but they are lower than the meteoritic Pd abundance by 0.08 dex. This indicates that NLTE is required to model the Pd I lines. Applying the treated NLTE method, we achieved an agreement of the solar photosphere and meteoritic abundances, although an uncertainty remains because the Pd I + HI collisions are poorly known.
4 Stellar sample, observations, and atmospheric parameters
4.1 Stellar sample and observational material
Our sample stars were selected from the stellar samples of Mashonkina et al. (2003, 2017a) and Hansen et al. (2012). The main criterion was a reliable detection of one line of Pd I at least in the high-resolution stellar spectrum. We used the spectral archives of the ESO instruments, the Ultraviolet and Visual Echelle Spectrograph (UVES), the Fiber-fed Extended Range Optical Spectrograph (FEROS), and the High Accuracy Radial velocity Planet Searcher (HARPS). Table A.1 indicates the program Ids, spectral ranges, spectral resolving power R = λ/∆λ, and the signal-to-noise ratio (S/N) corresponding to the blue spectral range, where the Pd I lines are located. For the longer wavelengths, where lines of FeII, Sr II, Ba II, and Eu II are located, the S/N > 100. The 48 stars of our sample are listed in Table B.1.
4.2 Effective temperatures
For 13 stars, we used the Teff determined in our previous studies by fitting the Balmer line wings (Mashonkina et al. 2003, six stars) and using the V-J, V-H, and V-K colors (Mashonkina et al. 2017a, seven stars). The uncertainty in Teff was estimated as 100 K for spectroscopic determinations and from 45 K to 80 K for different stars with photometric temperatures. For 28 stars, we adopted Teff derived from the infrared flux method (IRFM) by Casagrande et al. (2010, 2011, 23 stars), González Hernández & Bonifacio (2009, four stars), and Alonso et al. (1999, HD 204543). The uncertainty in Teff(IRFM) is 100 K on average. For HE1219-0312, we adopted Teff = 5145±100 K as obtained by Lombardo et al. (2022) based on Gaia photometry.
For the remaining stars, we calculated the photometric effective temperatures from the color-Teff calibrations of Casagrande et al. (2010, five dwarf stars) and Mucciarelli et al. (2021, a giant HD 122956). We used the V, J, H, K magnitudes as provided by the SIMBAD4 database, the BP, RP, G magnitudes from the Gaia EDR3 catalog (Gaia Collaboration 2021), and the interstellar reddening maps of Gontcharov & Mosenkov (2021) and Schlafly & Finkbeiner (2011), with the latter serving to constrain the upper limit for the color excess EB-V. The reddening estimates for other photometric bands were obtained based on the transformation relations from Casagrande & VandenBerg (2014, 2018). In these calculations, the atmospheric parameters reported by Hansen et al. (2012) were used as an initial guess. Different colors yield very similar effective temperatures, such that the uncertainty in Teff is estimated to be 60 K for the giant star and 4 K to 75 K for the dwarfs.
4.3 Surface gravities
For seven stars, we adopted the spectroscopic surface gravities, log gSp, derived by Mashonkina et al. (2017a) from the requirement that the NLTE abundances from Fe I and Fe II must be equal. The log gSp values agree within 0.15 dex with the surface gravities based on the Gaia distances, log gd, as shown by Mashonkina et al. (2023). The exception is HD 8724, with log gSp − log gd = −0.48, which was extensively discussed by Mashonkina et al. (2017a, 2023). For HE1219-0312, we adopted log g = 2.76, as derived by Lombardo et al. (2022) using the Gaia EDR3 parallax (Gaia Collaboration 2021).
For all the remaining stars, the standard relation between log gd, Teff, the absolute bolometric magnitude Mbol, and the stellar mass M was applied. We assumed M = 0.8 M⊙ since all our sample stars are old and still survive. The interstellar extinction was computed with RV = 3.1 and the E(B − V) values either published by Hansen et al. (2012) or obtained in this study, as described above. Bolometric corrections were extracted from the grids of Casagrande & VandenBerg (2018). In order to compute the distances of the stars, we used the Gaia EDR3 parallaxes (Gaia Collaboration 2021), because our sample stars are all within 1 kpc from the Sun. For the most distant star, HD 186478 (π = 1.0967±0.0179 mas), the distance was also calculated from the maximum of the distance probability distribution function, as recommended by Bailer-Jones (2015). This distance instead of d = 1/π leads to a shift of 0.03 dex in the derived surface gravity. We estimate the uncertainty in log gd as 0.1 dex. It arises primarily from the uncertainties in Teff and parallax, with the latter being insignificant for our stellar sample due to σπ/π < 1%.
Star HD 83212 appeared to be the exception, however. With Teff(IRFM) = 4550 K from González Hernández & Bonifacio (2009) and log gd = 1.70, we obtained a lower NLTE abundance from the lines of Fe I than from the lines of Fe II, by 0.52 dex. We also checked Teff(IRFM) = 4455 K from Alonso et al. (1999) with the corresponding log gd = 1.60 and failed to remove the abundance discrepancy. Then, using Teff = 4550 K and lines of FeI and FeII, we derived log gSp = 1.0. As in the case of HD 8724, it is hard to understand the source of the extremely large difference of 0.7 dex(!) between log gd and log gSp for HD 83212. The uncertainty in the Gaia EDR3 parallax π = 1.2723±0.0211 cannot result in the large error of the distance-based surface gravity. With RUVE = 0.866, HD 83212 is probably not a binary. A further abundance analysis of HD 83212 was made with log gSp = 1.0.
Spectral lines we used to determine the stellar Fe, Sr, Ba, and Eu abundances.
4.4 Metallicities and microturbulent velocities
We derived the stellar elemental abundances throughout using the synthetic spectrum method with the code SYNTHV_NLTE (Tsymbal et al. 2019), which computed the theoretical spectra, and the IDL visualization program BinMag (Kochukhov 2018), which enabled us to obtain the best fit to the observed spectrum. The required line list, together with atomic data, was taken from VALD.
The iron abundances were determined from the lines of FeII (Table 3) assuming LTE. The NLTE abundance corrections, ΔNLTE = log εNLTE − log εLTE, for these lines do not exceed 0.01 dex in the model atmospheres with [Fe/H] > −3 (Mashonkina et al. 2011). Our sample covers the −2.92 ≤ [Fe/H] ≤ −0.56 metallicity range. The [Fe/H] values were computed using the Solar System abundance log εFe,met = 7.45 (Lodders 2021). The dispersion in the single-line measurements around the mean, σFe, is 0.03 to 0.06 dex for different stars. The exception is HE1219-0312 with [Fe/H] = −2.74 ± 0.18 adopted from Lombardo et al. (2022). We computed the microturbulent velocities ξt using the empirical relations deduced by Sitnova et al. (2015) and Mashonkina et al. (2017a) for the dwarfs and the giants, respectively.
Table B.1 presents the atmospheric parameters we obtained. Hereafter, we refer to the stars with log g ≤ 3.0 as giants and to the stars with the greater log g as dwarfs.
5 Stellar abundances of Pd, Sr, Ba, and Eu
For Pd, Sr, Ba, and Eu, we determined the NLTE and LTE abundances. The code SYNTHV_NLTE (Tsymbal et al. 2019) is designed to implement the departure coefficients from the code DETAIL and to calculate the lines of the investigated species including NLTE effects and assuming LTE for the lines of other elements.
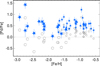 |
Fig. 5 NLTE (stars) and LTE (open circles) abundance ratios [Pd/Fe] for the sample stars. The smaller and larger symbols correspond to the dwarfs (log g > 3.0) and the giants (log g ≤ 3.0), respectively. For each star, the error bar corresponds to σtot. |
5.1 Palladium
Of the five lines listed in Table 1, PdI 3609 and 3690 Å were not detected in any of our sample stars. In contrast, PdI 3404 Å was measured for each star. For 15 stars, it was the only detected palladium line. The observational errors due to the uncertainties in the continuum placement and accounting for the blending lines were evaluated as the stochastic error σPd of the mean abundance. For our sample stars, σPd ranges from 0.04 dex to 0.24 dex (Table B.1). When Pd I 3404 Å was used alone, we estimated σPd as 0.1 dex due to the uncertainty in the continuum placement.
For each star, the NLTE calculations were performed with SH = 0.1, and we verified for the selected stars the effect of varying SH on the derived abundances (see below). The NLTE effects for Pd I grow toward lower log g and higher Teff. For example, for PdI 3404Å, ΔNLTE = 0.35 dex for HD 29907 (5500/4.59/−1.51), 0.45 dex for HD 59392 (6045/3.95/−1.57), and 0.61 dex for HD 204543 (4670/1.41/−1.58).
In line with Hansen et al. (2012), our sample giants have lower LTE abundances than the dwarfs with similar metallicities (Fig. 5). Since the NLTE corrections are greater for the giants than for the dwarfs, the abundance difference between these two group of stars was largely removed in the NLTE calculations. In NLTE, our sample stars reveal enhancements of Pd relative to Fe, with [Pd/Fe] ≃ 0.5, on average. Our two r-II stars have substantially higher enhancements, with [Pd/Fe] = 0.88 and 1.43, respectively.
In Fig. 6, we compare the obtained NLTE abundances to the LTE data from Hansen et al. (2012); Peterson (2013); Wu et al. (2015); Aoki et al. (2017); Sneden et al. (2003); Hill et al. (2002, 2017); Lai et al. (2008), and Hayek et al. (2009). With the NLTE approach, the [Pd/Fe] ratios increase, and this is important to understand the mechanisms of palladium production during the Galaxy history better (see Sect. 6).
5.2 Uncertainties in the Pd NLTE abundances
In order to estimate the systematic abundance errors caused by applying a rough theoretical approximation for a treatment of inelastic processes in the Pd I + HI collisions, the NLTE calculations were performed for a number of stars using not only SH = 0.1, but also SH = 0 and 1. For Pd I 3404Å in two stars that represent dwarfs and giants, namely HD 122196 and HD 122563, Table 4 indicates the abundance differences between different line formation scenarios. They are substantially larger for the giant than the dwarf model. It is clearly essential to apply the NLTE method for determining stellar Pd abundances, regardless of the adopted SH magnitude. The effect of increasing the hydrogen collisional rates from SH = 0.1 to SH = 1 is smaller than the effect of neglecting them completely. In the case of SH = 0, the Pd abundances can be higher than the value in Table B.1, by about 0.2 dex for the giant stars and by about 0.05 dex for the dwarf stars.
We also calculated the abundance errors caused by the uncertainties in Teff and log g, which are ±100 K and ±0.1 dex for the methods we used. Variations in ξt affect the derived Pd abundances very little because the Pd I lines are weak.
To plot Fig. 5, we computed the total uncertainty σtot in [Pd/Fe] for each star by the quadratic sum of σPd, σFe, and abundance errors due to the uncertainties in Teff and log g. Table 4 summarizes the abundance errors for the two selected stars.
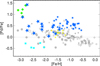 |
Fig. 6 NLTE abundance ratios [Pd/Fe] derived in this study (stars) compared to the literature LTE values. Different symbols are used for different papers. The filled gray circles show Hansen et al. (2012), open circles show Wu et al. (2015), yellow triangles show Peterson (2013), cyan squares show Aoki et al. (2017), and green rhombi show five r-II stars from Sneden et al. (2003); Hill et al. (2002, 2017); Lai et al. (2008); Hayek et al. (2009). The smaller and larger symbols correspond to the dwarfs and giants, respectively. |
Error estimates (dex) for the abundances derived from Pd I 3404 Å.
5.3 Strontium, barium, and europium
We list the spectral lines of Sr II, Ba II, and Eu II that we used in the abundance analyses in Table 3. Each of these lines is composed of the isotopic and HFS components. Their wavelengths and gf-values along with the van der Waals damping constants were taken from a recent version of VALD (Pakhomov et al. 2019). We employed the Solar System isotopic fractions from Lodders (2021). The derived abundances depend only weakly on the isotopic mixture we adopted in the calculations.
For the four stars, we did not find spectra covering the lines of Eu II and Sr II. The lines of Eu II cannot be extracted from noise in the spectrum of CD −24 1782 with [Fe/H] = −2.67. The spectrum of HD 166913 around the Eu II 4129 and 4205 Å lines is affected by absorptions of unknown origin, such that even the upper limit of the Eu abundance is uncertain.
The NLTE calculations were performed using the methods we used in our previous studies, Mashonkina & Gehren (2000, Eu II), Mashonkina & Belyaev (2019, Ba II), and Mashonkina et al. (2022, Sr II). The LTE and NLTE [X/Fe] ratios we obtained are presented in Table B.2. The Solar System abundances were taken from Lodders (2021): log εsr,met = 2.88, log εBa,met = 2.17, and log εEu,met = 0.51.
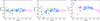 |
Fig. 7 Abundance ratios of Sr, Ba, Eu to Fe obtained in this study (NLTE, stars) compared to the corresponding ratios of the comparison stellar samples. The magenda triangles show Zhao et al. (2016) + Mashonkina et al. (2017b), the gray diamonds show Hansen et al. (2012), the green squares show Reggiani et al. (2017), and the open circles show François et al. (2007) + Andrievsky et al. (2011). |
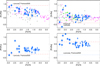 |
Fig. 8 Same as in Fig. 7 for the abundance ratios of Eu, Ba, Sr, and Pd. The long-dashed red and dash-dotted blue lines indicate the elemental ratios predicted by Prantzos et al. (2020) for pure r- and s-process, respectively. The short-dashed red line corresponds to the empirical r-process ratio [Sr/Ba]r-II = −0.38. |
5.4 Notes on individual stars
Three stars of our sample are not shown in Figs. 7 and 8, and they are excluded from the further discussion because their chemical abundances indicate nucleosynthesis origins that are distinct from those of the chemical elements in halo stars with a similar metallicity. The arguments are listed below.
- (i)
Star BD-01 2582 was identified as a carbon-enhanced (CEMP) star by Kraft et al. (1982). Based on the abundances [C/Fe] = 1.02, [Ba/Fe] = 1.05, [Eu/Fe] = 0.36 determined by Roederer et al. (2014), Yoon et al. (2016) classified the star as CEMP-s. Zepeda et al. (2022) obtained a very similar C enhancement ([C/Fe] = 1.03), but a high enhancement of Eu relative to Ba ([Eu/Ba] = 0.57) and classified the star as CEMP-r. We confirm that BD-01 2582 is a CEMP star, with [C/Fe] = 0.97, but its NLTE abundances of Ba and Eu support neither the CEMP-s, nor the CEMP-r classification. With similar enhancements of Ba and Eu relative to Fe, BD-01 2582 can be classified as CEMP-r/s. A detailed abundance analysis of this star will be presented in a separate paper.
- (ii)
Star HD 106038 is known as a Be-rich halo dwarf (Smiljanic et al. 2008). This phenomenon can be explained by a formation of the star in the vicinity of a hypernova. Smiljanic et al. (2008) noted, however, that HD 106038 is also enhanced with Ba, and this might pose a problem for the hypernova scenario. We found HD 106038 to be enhanced in Sr, Ba, and Eu at a similar level of 0.5 dex. This pattern of the heavy element abundance is distinct from that for other stars of similar metallic-ity ([Fe/H] = −1.34) and cannot be explained within a collapsar or hypernova scenario (see, for example, Anand et al. 2024). The origin of the chemical elements in HD 106038 remains an open question.
- (iii)
Star CD-45 3283 might have an extragalactic origin. Its [O/Fe] = −0.5 value determined by Nissen et al. (2014) is lower by one order of magnitude than that for the halo stars with a similar metallicity ([Fe/H] = −0.95), while similarly low [a/Fe] ratios, including [O/Fe], are found at the same metallici-ties in dwarf spheroidal (dSph) galaxies (e.g. Sculptor dSph, Hill et al. 2019). The Ba abundance we obtained for CD-45 3283, [Ba/Fe] = 0.17, is not exceptional for mildly MP stars in our Galaxy or Galaxy satellites. We did not determine the abundances of Sr and Eu because no spectra were observed.
6 Galactic trends in the elemental ratios
In this section, we first investigate the origins of Eu, Ba, and Sr in our sample stars and then discuss the origin of Pd based on an analysis of the abundance ratios involving Pd. For comparison with observations, we applied the s-process calculations of Prantzos et al. (2020), which include contributions from intermediate-mass stars (main s-process) and massive rotating stars (weak s-process). Using the Solar System abundances, Prantzos et al. (2020) provided fractions of individual isotopes and elements that originated from the s-process, and the r-residuals were obtained by subtracting the s-process contributions from the total abundances. Based on the predicted r-residuals, we computed the r-process elemental ratios [Eu/Ba]r = 0.90, [Sr/Ba]r = −0.17, [Pd/Eu]r = −0.24, and [Pd/Ba]r = 0.66. The r-II stars serve as a benchmark for the abundance pattern of heavy elements produced by the pure r-process. The elemental ratios we obtained by averaging the data for the best representatives of the r-II stars: [Eu/Ba]r-II = 0.88 (Mashonkina & Christlieb 2014, eight stars) and [Sr/Ba]r-II = −0.38 (Mashonkina et al. 2017b, six stars) are referred to as the empirical r-process ratios.
In the [Fe/H] > −2 range, our stellar sample reveals trends for the elemental ratios involving Eu, Ba, and Sr (Figs. 7 and 8) that are typical for the Galactic halo and thick disk stellar populations. The comparison stellar samples were taken from François et al. (2007); Andrievsky et al. (2011); Hansen et al. (2012); Zhao et al. (2016); Mashonkina et al. (2017b), and Reggiani et al. (2017). Europium is enhanced relative to Fe, and there is a clear decline in [Eu/Fe] for [Fe/H] > −1 that indicates the onset of Fe production by type Ia supernovae (SNeIa). Europium is enhanced relative to Ba, and [Eu/Ba] decreases toward higher metallicity, which means that the contribution of the main s-process in AGB stars to the Ba production increases. The [Sr/Fe], [Ba/Fe], and [Sr/Ba] ratios are close to the solar ones, indicating a common origin of Sr and Ba in the r- and main s-process.
In the [Fe/H] > −2 range, Pd is enhanced relative to Fe and Ba and is tightly correlated with Eu (Fig. 8). By comparing the observed average [Pd/Eu] = 0.09±0.10 with [Pd/Eu]r = −0.24 and [Pd/Eu]s = 0.97 (Prantzos et al. 2020), we estimated the contributions of the r- and s-process to the Pd abundances of our −1.71 ≤ [Fe/H] ≤ −0.56 stars as approximately 70% and 30%.
In the very metal-poor (VMP; [Fe/H] < −2) region, Fig. 7 shows a large spread of [Eu/Fe] and [Ba/Fe] that suggests that nucleosynthesis events are rare for heavy elements and mixing of the produced nuclei is incomplete. Although our two r-II stars ([Eu/Fe] > 1), an r-process poor star HD 122563 ([Eu/Fe] = −0.57), and HD 128279 ([Eu/Fe] = −0.02) have very different [Eu/Fe] ratios, they agree well with the remaining sample stars on the plane of [Eu/Ba] versus [Fe/H] (Fig. 8). They reveal a dominant (r-II stars) or significant contribution of the r-process to their heavy element abundances.
The [Pd/Eu] and [Pd/Ba] ratios of our three highest MP stars (HE2327-5642, HE1219-0312, and HD 126587) provide clear evidence for a pure r-process origin of Pd in these stars. A dominant contribution of the r-process to the Pd abundance is revealed by HD 108317 ([Fe/H] = −2.13, [Pd/Eu] = −0.07±0.14, [Pd/Ba] = 0.56±0.10).
Palladium is strongly enhanced relative to Ba and Eu in HD 122563 and CD −24 1782 (only Ba was measured), however. These two stars have high [Sr/Ba] > 0.5 ratios, which suggests a contribution to their Sr abundances from a source in addition to the r-process. Based on determinations of the odd-to-even isotope abundance ratio for barium, Sitnova et al. (2025) provided evidence that the early (or nonstandard) s-process in extremely metal-poor (EMP; [Fe/H] < −3) fast-rotating massive stars (Pignatari et al. 2008; Cescutti & Chiappini 2014) is the source of the additional Sr in HD 122563 and estimated that the contributions of the r-process and the early s-process are 55% and 45%, respectively. Calculations of the nonstandard s-process in the [Fe/H] = −1.8 models of 20 to 60 M⊙ showed that the production factors for Pd grow by 2-3 dex in the rotating (40% of the critical velocity) models compared to the nonrotating models (Choplin et al. 2018). The increase is greater, more than 4 dex, in the [Fe/H] = −3.8 models (Frischknecht et al. 2016). We propose that nucleosynthesis in fast-rotating massive stars contributed to the abundance of not only Sr, but also Pd in HD 122563. It is natural to assume that the matter out of which the star CD-24 1782 formed was enriched by similar sources.
7 Conclusions
We constructed a new comprehensive model atom for Pd I and derived the NLTE abundances of Pd in the Sun and the sample of 48 stars covering the −2.92 ≤ [Fe/H] ≤ −0.56 metallicity range for the first time. In the NLTE calculations, the Pd I + HI collisions were treated by applying the formulas of Steenbock & Holweger (1984) with the scaling factor SH. NLTE leads to weakened lines of Pd I and positive NLTE abundance corrections that increase toward higher Teff and lower log g up to ΔNLTE(SH = 0.1) = 0.47 dex for the 6050/3.90/−1.65 model and ΔNLTE(SH = 0.1) = 0.82 dex for the 4600/1.40/−2.46 model. In the case of pure electron collisions, ΔNLTE increases by 0.05 dex and 0.2 dex for the log g ≳ 4 and log g < 2 models, respectively.
The solar Pd abundance was derived from the PdI 3242, 3404, and 3609 Å lines in the intensity spectrum of the solar disk center (Delbouille et al. 1973) using the classical MARCS model atmosphere (Gustafsson et al. 2008). The NLTE abundances log εPd,⊙(SH = 0.1) = 1.70±0.02 and log εPd⊙(SH = 1) = 1.61±0.02 we obtained are consistent within the error bars with the meteoritic value log εpd,met = 1.65 ±0.02 (Lodders 2021), while the LTE abundance is lower by 0.16 dex.
Using the high-resolution and high S/N spectra from the ESO archives, we selected 48 stars with measurable lines of Pd I. In determinations of stellar atmospheric parameters, we relied on the best available methods and data. The effective temperatures were taken from our previous studies and determinations of Teff(IRFM) by Casagrande et al. (2010, 2011); González Hernández & Bonifacio (2009), and Alonso et al. (1999). For the six stars without a Teff (IRFM), we employed the color-Teff calibrations of Casagrande et al. (2010) and Mucciarelli et al. (2021). The surface gravities were based on the Gaia EDR3 parallaxes (Gaia Collaboration 2021). The exceptions are seven stars from Mashonkina et al. (2017a) and HD 83212 with spectroscopic surface gravities. The iron abundances were determined from the FeII lines.
The NLTE abundances were determined for Pd and for Eu, Ba and Sr, which are the best representatives of the elements that are effectively produced in the r-process, the main s-process, and the weak s-process, respectively. Our findings are summarized below:
For Pd, NLTE largely removes the discrepancies in the LTE abundances between giant and dwarf stars with similar metallicities;
Palladium is enhanced relative to Fe throughout the whole metallicity range we investigated;
Palladium is tightly correlated with Eu in the −1.71 ≤ [Fe/H] ≤ −0.56 stars. We estimated the contributions of the r- and s-processes to their Pd abundances as 70% and 30% based on the predictions of Prantzos et al. (2020) for the solar r/s ratio;
Palladium has a pure r-process origin in our two r-II stars. Two other stars in the [Fe/H] < −2 range reveal a dominant contribution of the r-process to their Pd abundances;
Stars HD 122563 and CD-24 1782 are strongly enhanced with not only Sr, but also Pd relative to Ba and Eu. This suggests that the contributions to Sr and Pd come from a distinct channel in addition to the r-process. Based on the results of Sitnova et al. (2025), we propose that the additional Pd in these two stars comes from VMP fast-rotating massive stars. We conclude that it is essential to use the NLTE approach to obtain accurate stellar abundances that can serve as observational constraints to the models of Galactic Pd evolution.
Acknowledgements
We made use of the ESO UVES, HARPS, and FEROS spectral archives, the MARCS, NIST, SIMBAD, VALD, and ADS5 databases.
References
- Alonso, A., Arribas, S., & Martínez-Roger, C. 1999, A&AS, 139, 335 [NASA ADS] [CrossRef] [EDP Sciences] [Google Scholar]
- Anand, S., Barnes, J., Yang, S., et al. 2024, ApJ, 962, 68 [Google Scholar]
- Andrievsky, S. M., Spite, F., Korotin, S. A., et al. 2011, A&A, 530, A105 [CrossRef] [EDP Sciences] [Google Scholar]
- Aoki, M., Ishimaru, Y., Aoki, W., & Wanajo, S. 2017, ApJ, 837, 8 [NASA ADS] [CrossRef] [Google Scholar]
- Asplund, M., Amarsi, A. M., & Grevesse, N. 2021, A&A, 653, A141 [NASA ADS] [CrossRef] [EDP Sciences] [Google Scholar]
- Bagnulo, S., Jehin, E., Ledoux, C., et al. 2003, The Messenger, 114, 10 [Google Scholar]
- Bailer-Jones, C. A. L. 2015, PASP, 127, 994 [Google Scholar]
- Biemont, E., Grevesse, N., Kwiatkowski, M., & Zimmermann, P. 1982, A&A, 108, 127 [Google Scholar]
- Burbidge, E. M., Burbidge, G. R., Fowler, W. A., & Hoyle, F. 1957, Rev. Mod. Phys., 29, 547 [NASA ADS] [CrossRef] [Google Scholar]
- Butler, K. 1984, Ph.D. Thesis, University of London, UK [Google Scholar]
- Casagrande, L., & VandenBerg, D. A. 2014, MNRAS, 444, 392 [Google Scholar]
- Casagrande, L., & VandenBerg, D. A. 2018, MNRAS, 479, L102 [NASA ADS] [CrossRef] [Google Scholar]
- Casagrande, L., Ramírez, I., Meléndez, J., Bessell, M., & Asplund, M. 2010, A&A, 512, A54 [NASA ADS] [CrossRef] [EDP Sciences] [Google Scholar]
- Casagrande, L., Schönrich, R., Asplund, M., et al. 2011, A&A, 530, A138 [NASA ADS] [CrossRef] [EDP Sciences] [Google Scholar]
- Cescutti, G., & Chiappini, C. 2014, A&A, 565, A51 [NASA ADS] [CrossRef] [EDP Sciences] [Google Scholar]
- Choplin, A., Hirschi, R., Meynet, G., et al. 2018, A&A, 618, A133 [NASA ADS] [CrossRef] [EDP Sciences] [Google Scholar]
- Christlieb, N., Beers, T. C., Barklem, P. S., et al. 2004, A&A, 428, 1027 [NASA ADS] [CrossRef] [EDP Sciences] [Google Scholar]
- Cowan, J. J., Sneden, C., Lawler, J. E., et al. 2021, Rev. Mod. Phys., 93, 015002 [Google Scholar]
- Delbouille, L., Roland, G., & Neven, L. 1973, Atlas photometrique du spectre solaire de [lambda] 3000 a [lambda] 10000 [Google Scholar]
- Drawin, H. W. 1969, Zeitsch. Phys., 225, 483 [Google Scholar]
- Engleman, R., Litzén, U., Lundberg, H., & Wyart, J.-F. 1998, Phys. Scr, 57, 345 [Google Scholar]
- François, P., Depagne, E., Hill, V., et al. 2007, A&A, 476, 935 [Google Scholar]
- Frebel, A., Simon, J. D., Geha, M., & Willman, B. 2010, ApJ, 708, 560 [NASA ADS] [CrossRef] [Google Scholar]
- Frischknecht, U., Hirschi, R., Pignatari, M., et al. 2016, MNRAS, 456, 1803 [Google Scholar]
- Gaia Collaboration (Brown, A. G. A., et al.) 2021, A&A, 649, A1 [NASA ADS] [CrossRef] [EDP Sciences] [Google Scholar]
- Giddings, J. 1981, Ph.D. Thesis, University of London, UK [Google Scholar]
- Gilmore, G., Norris, J. E., Monaco, L., et al. 2013, ApJ, 763, 61 [NASA ADS] [CrossRef] [Google Scholar]
- Gontcharov, G. A., & Mosenkov, A. V. 2021, MNRAS, 500, 2607 [Google Scholar]
- González Hernández, J. I., & Bonifacio, P. 2009, A&A, 497, 497 [Google Scholar]
- Grevesse, N., & Sauval, A. J. 1999, A&A, 347, 348 [NASA ADS] [Google Scholar]
- Grevesse, N., Scott, P., Asplund, M., & Sauval, A. J. 2015, A&A, 573, A27 [CrossRef] [EDP Sciences] [Google Scholar]
- Gustafsson, B., Edvardsson, B., Eriksson, K., et al. 2008, A&A, 486, 951 [NASA ADS] [CrossRef] [EDP Sciences] [Google Scholar]
- Hansen, C. J., Primas, F., Hartman, H., et al. 2012, A&A, 545, A31 [NASA ADS] [CrossRef] [EDP Sciences] [Google Scholar]
- Hayek, W., Wiesendahl, U., Christlieb, N., et al. 2009, A&A, 504, 511 [NASA ADS] [CrossRef] [EDP Sciences] [Google Scholar]
- Hill, V., Plez, B., Cayrel, R., et al. 2002, A&A, 387, 560 [CrossRef] [EDP Sciences] [Google Scholar]
- Hill, V., Christlieb, N., Beers, T. C., et al. 2017, A&A, 607, A91 [NASA ADS] [CrossRef] [EDP Sciences] [Google Scholar]
- Hill, V., Skúladóttir, Á., Tolstoy, E., et al. 2019, A&A, 626, A15 [NASA ADS] [CrossRef] [EDP Sciences] [Google Scholar]
- Holweger, H., & Mueller, E. A. 1974, Sol. Phys., 39, 19 [NASA ADS] [CrossRef] [Google Scholar]
- Käppeler, F., Gallino, R., Bisterzo, S., & Aoki, W. 2011, Rev. Mod. Phys., 83, 157 [Google Scholar]
- Kochukhov, O. 2018, BinMag: Widget for comparing stellar observed with theoretical spectra [Google Scholar]
- Kraft, R. P., Suntzeff, N. B., Langer, G. E., et al. 1982, PASP, 94, 55 [Google Scholar]
- Kramida, A., Ralchenko, Y., Reader, J., & Team, N. A. 2024, NIST Atomic Spectra Database (version 5.12) (USA) [Google Scholar]
- Kurucz, R. L. 2017, Robert L. Kurucz on-line database of observed and predicted atomic transitions, http://kurucz.harvard.edu/atoms/4600/ [Google Scholar]
- Lai, D. K., Bolte, M., Johnson, J. A., et al. 2008, ApJ, 681, 1524 [NASA ADS] [CrossRef] [Google Scholar]
- Lawler, J. E., Wickliffe, M. E., den Hartog, E. A., & Sneden, C. 2001, ApJ, 563, 1075 [CrossRef] [Google Scholar]
- Lodders, K. 2021, Space Sci. Rev., 217, 44 [NASA ADS] [CrossRef] [Google Scholar]
- Lombardo, L., Bonifacio, P., François, P., et al. 2022, A&A, 665, A10 [NASA ADS] [CrossRef] [EDP Sciences] [Google Scholar]
- Lombardo, L., Hansen, C. J., Rizzuti, F., et al. 2025, A&A, 693, A293 [NASA ADS] [CrossRef] [EDP Sciences] [Google Scholar]
- Mashonkina, L. I., & Belyaev, A. K. 2019, Astron. Lett., 45, 341 [NASA ADS] [CrossRef] [Google Scholar]
- Mashonkina, L., & Christlieb, N. 2014, A&A, 565, A123 [NASA ADS] [CrossRef] [EDP Sciences] [Google Scholar]
- Mashonkina, L., & Gehren, T. 2000, A&A, 364, 249 [NASA ADS] [Google Scholar]
- Mashonkina, L., Gehren, T., Travaglio, C., & Borkova, T. 2003, A&A, 397, 275 [CrossRef] [EDP Sciences] [Google Scholar]
- Mashonkina, L., Gehren, T., Shi, J.-R., Korn, A. J., & Grupp, F. 2011, A&A, 528, A87 [NASA ADS] [CrossRef] [EDP Sciences] [Google Scholar]
- Mashonkina, L., Jablonka, P., Pakhomov, Y., Sitnova, T., & North, P. 2017a, A&A, 604, A129 [NASA ADS] [CrossRef] [EDP Sciences] [Google Scholar]
- Mashonkina, L., Jablonka, P., Sitnova, T., Pakhomov, Y., & North, P. 2017b, A&A, 608, A89 [NASA ADS] [CrossRef] [EDP Sciences] [Google Scholar]
- Mashonkina, L., Sitnova, T., Yakovleva, S. A., & Belyaev, A. K. 2019, A&A, 631, A43 [NASA ADS] [CrossRef] [EDP Sciences] [Google Scholar]
- Mashonkina, L., Pakhomov, Y. V., Sitnova, T., et al. 2022, MNRAS, 509, 3626 [Google Scholar]
- Mashonkina, L., Pakhomov, Y., Sitnova, T., et al. 2023, MNRAS, 524, 3526 [Google Scholar]
- McWilliam, A. 1998, AJ, 115, 1640 [NASA ADS] [CrossRef] [Google Scholar]
- Mucciarelli, A., Bellazzini, M., & Massari, D. 2021, A&A, 653, A90 [NASA ADS] [CrossRef] [EDP Sciences] [Google Scholar]
- Nissen, P. E., Chen, Y. Q., Carigi, L., Schuster, W. J., & Zhao, G. 2014, A&A, 568, A25 [NASA ADS] [CrossRef] [EDP Sciences] [Google Scholar]
- Pakhomov, Y. V., Ryabchikova, T. A., & Piskunov, N. E. 2019, Astron. Rep., 63, 1010 [NASA ADS] [CrossRef] [Google Scholar]
- Peterson, R. C. 2013, ApJ, 768, L13 [NASA ADS] [CrossRef] [Google Scholar]
- Pignatari, M., Gallino, R., Meynet, G., et al. 2008, ApJ, 687, L95 [Google Scholar]
- Prantzos, N., Abia, C., Cristallo, S., Limongi, M., & Chieffi, A. 2020, MNRAS, 491, 1832 [Google Scholar]
- Raassen, A. J. J., & Uylings, P. H. M. 1998, A&A, 340, 300 [Google Scholar]
- Reader, J., Corliss, C. H., Wiese, W. L., & Martin, G. A. 1980, Wavelengths and transition probabilities for atoms and atomic ions: Part 1. Wavelengths, part 2. Transition probabilities [Google Scholar]
- Reetz, J. K. 1991, Diploma Thesis, Universität München, Germany [Google Scholar]
- Reggiani, H., Meléndez, J., Kobayashi, C., Karakas, A., & Placco, V. 2017, A&A, 608, A46 [NASA ADS] [CrossRef] [EDP Sciences] [Google Scholar]
- Reggiani, H., Schlaufman, K. C., Casey, A. R., Simon, J. D., & Ji, A. P. 2021, AJ, 162, 229 [NASA ADS] [CrossRef] [Google Scholar]
- Roederer, I. U., Preston, G. W., Thompson, I. B., et al. 2014, AJ, 147, 136 [Google Scholar]
- Ryabchikova, T., Piskunov, N., Kurucz, R. L., et al. 2015, Phys. Scr, 90, 054005 [Google Scholar]
- Schlafly, E. F., & Finkbeiner, D. P. 2011, ApJ, 737, 103 [Google Scholar]
- Seaton, M. J. 1962, in Atomic and Molecular Processes, ed. D. R. Bates, 375 [Google Scholar]
- Sitnova, T., Zhao, G., Mashonkina, L., et al. 2015, ApJ, 808, 148 [Google Scholar]
- Sitnova, T. M., Lombardo, L., Mashonkina, L. I., et al. 2025, A&A, 699, A262 [NASA ADS] [CrossRef] [EDP Sciences] [Google Scholar]
- Smiljanic, R., Pasquini, L., Primas, F., et al. 2008, MNRAS, 385, L93 [NASA ADS] [CrossRef] [Google Scholar]
- Sneden, C., Cowan, J. J., Lawler, J. E., et al. 2003, ApJ, 591, 936 [NASA ADS] [CrossRef] [Google Scholar]
- Steenbock, W., & Holweger, H. 1984, A&A, 130, 319 [NASA ADS] [Google Scholar]
- Takeda, Y. 1994, PASJ, 46, 53 [NASA ADS] [Google Scholar]
- Tsymbal, V., Ryabchikova, T., & Sitnova, T. 2019, in Astronomical Society of the Pacific Conference Series, 518, eds. D. O. Kudryavtsev, I. I. Romanyuk, & I. A. Yakunin, 247 [Google Scholar]
- van Regemorter, H. 1962, ApJ, 136, 906 [NASA ADS] [CrossRef] [Google Scholar]
- Wu, X., Wang, L., Shi, J., Zhao, G., & Grupp, F. 2015, A&A, 579, A8 [NASA ADS] [CrossRef] [EDP Sciences] [Google Scholar]
- Xu, H. L., Sun, Z. W., Dai, Z. W., et al. 2006, A&A, 452, 357 [NASA ADS] [CrossRef] [EDP Sciences] [Google Scholar]
- Yoon, J., Beers, T. C., Placco, V. M., et al. 2016, ApJ, 833, 20 [Google Scholar]
- Zepeda, J., Rasmussen, K. C., Beers, T. C., et al. 2022, ApJ, 927, 13 [NASA ADS] [CrossRef] [Google Scholar]
- Zhao, G., Mashonkina, L., Yan, H. L., et al. 2016, ApJ, 833, 225 [Google Scholar]
In the classical notation, where [X/Y] = log(NX/NY)star − log(NX/NY)⊙ for each pair of elements X and Y.
Appendix A Observational material
Sources and characteristics of the used observational material taken from the ESO archives.
Appendix B Stellar abundances of Pd, Sr, Ba, and Eu
Atmospheric parameters for the sample stars and palladium NLTE and LTE abundances, with the [Pd/Fe] ratios computed using log εPd,met = 1.65 (Lodders 2021).
NLTE and LTE abundance ratios [X/Fe] for Sr, Ba, and Eu.
All Tables
Solar LTE and NLTE (two scenarios: with SH = 0.1 and 1) abundances from individual lines of Pd I.
Sources and characteristics of the used observational material taken from the ESO archives.
Atmospheric parameters for the sample stars and palladium NLTE and LTE abundances, with the [Pd/Fe] ratios computed using log εPd,met = 1.65 (Lodders 2021).
All Figures
|
Fig. 1 Energy levels of Pd I, as presented in the model atom. The spectral lines we used in the Pd abundance analysis arise in the transitions that are shown as continuous lines. The term designations correspond to the calculations of the atomic structure by Kurucz (2017). |
| In the text | |
|
Fig. 2 Departure coefficients, b, for the selected levels of Pd I as a function of log τ5000 in the model atmosphere with Teff = 5780 K, log g = 4.44, and [Fe/H] = 0. The tick marks indicate the optical depth unity for the Pd I 3242 (1) and 3404 Å (2) line centers. |
| In the text | |
|
Fig. 3 Best NLTE (SH = 0.1) fits (continuous curves) of the Pd I lines in the intensity spectrum of the solar disk center (Delbouille et al. 1973, open circles). The obtained NLTE abundances are indicated in Table 1. In each panel, the dashed curve shows the LTE profile computed with the NLTE abundance derived from this line, and the dotted curve shows the synthetic spectrum without the contribution of the Pd I line. |
| In the text | |
|
Fig. 4 Best fit (continuous curve) of the 3515.8-3518.5 Å range in the intensity spectrum of the solar disk center (Delbouille et al. 1973, open circles). The dotted curve shows the synthetic spectrum without the contribution of the Pd I 3516 Å line. The dash-dotted line shows the local continuum level we adopted for Pd I 3516 Å to derive the element abundance listed in Table 1. |
| In the text | |
|
Fig. 5 NLTE (stars) and LTE (open circles) abundance ratios [Pd/Fe] for the sample stars. The smaller and larger symbols correspond to the dwarfs (log g > 3.0) and the giants (log g ≤ 3.0), respectively. For each star, the error bar corresponds to σtot. |
| In the text | |
|
Fig. 6 NLTE abundance ratios [Pd/Fe] derived in this study (stars) compared to the literature LTE values. Different symbols are used for different papers. The filled gray circles show Hansen et al. (2012), open circles show Wu et al. (2015), yellow triangles show Peterson (2013), cyan squares show Aoki et al. (2017), and green rhombi show five r-II stars from Sneden et al. (2003); Hill et al. (2002, 2017); Lai et al. (2008); Hayek et al. (2009). The smaller and larger symbols correspond to the dwarfs and giants, respectively. |
| In the text | |
|
Fig. 7 Abundance ratios of Sr, Ba, Eu to Fe obtained in this study (NLTE, stars) compared to the corresponding ratios of the comparison stellar samples. The magenda triangles show Zhao et al. (2016) + Mashonkina et al. (2017b), the gray diamonds show Hansen et al. (2012), the green squares show Reggiani et al. (2017), and the open circles show François et al. (2007) + Andrievsky et al. (2011). |
| In the text | |
|
Fig. 8 Same as in Fig. 7 for the abundance ratios of Eu, Ba, Sr, and Pd. The long-dashed red and dash-dotted blue lines indicate the elemental ratios predicted by Prantzos et al. (2020) for pure r- and s-process, respectively. The short-dashed red line corresponds to the empirical r-process ratio [Sr/Ba]r-II = −0.38. |
| In the text | |
Current usage metrics show cumulative count of Article Views (full-text article views including HTML views, PDF and ePub downloads, according to the available data) and Abstracts Views on Vision4Press platform.
Data correspond to usage on the plateform after 2015. The current usage metrics is available 48-96 hours after online publication and is updated daily on week days.
Initial download of the metrics may take a while.