| Issue |
A&A
Volume 706, February 2026
|
|
|---|---|---|
| Article Number | A48 | |
| Number of page(s) | 9 | |
| Section | Cosmology (including clusters of galaxies) | |
| DOI | https://doi.org/10.1051/0004-6361/202555984 | |
| Published online | 29 January 2026 | |
Sensitivity of the redshifted 21 cm signal from the Dark Ages to parameters of primordial magnetic fields
1
Astronomical Observatory of Ivan Franko National University of Lviv, Kyryla i Methodia str. 8 Lviv 79005, Ukraine
2
Bogolyubov Institute for Theoretical Physics of the NAS of Ukraine Metrolohichna Str. 14-b Kyiv 03143, Ukraine
3
Dipartimento di Fisica e Astronomia, Universitá di Bologna Via Gobetti 93/2 40122 Bologna, Italy
★ Corresponding author: This email address is being protected from spambots. You need JavaScript enabled to view it.
Received:
17
June
2025
Accepted:
17
November
2025
Abstract
We analyse the impact of the decaying magnetic turbulence of primordial magnetic fields (PMFs) and ambipolar diffusion on the ionisation and thermal history of the Dark Ages Universe (30 ≤ z ≤ 300), and its imprint on the spectral profile of the global signal in the redshifted 21 cm hydrogen line. The heating function caused by decaying magnetic turbulence monotonically decreases after cosmological recombination; its amplitude strongly depends on the strength of the PMFs’ B0 and weakly depends on the spectral index of the initial power spectrum of the PMFs’ nB. The heating function caused by ambipolar diffusion, in contrast, noticeably depends on the spectral index in the range −3 ≲ nB ≲ 4 but is subdominant in the Dark Ages epoch for PMF models with B0 ≲ 0.5 nG. We computed the ionisation and thermal history of intergalactic gas from the cosmological recombination up to the end of the Dark Ages epoch for a range of PMF parameters, 0.05 ≲ B0 ≲ 0.5 nG, −2.9 ≲ nB ≲ 4, and show the essentially distinguished thermal evolution from one in the Lambda cold dark matter (ΛCDM) model. We also show that the profile of the redshifted 21 cm hydrogen line is very sensitive to the PMF parameters from this range and can be used for their constraints in conjunction with other observational data.
Key words: cosmological parameters / cosmology: miscellaneous / early Universe / dark ages / reionization / first stars
© The Authors 2026
 Open Access article, published by EDP Sciences, under the terms of the Creative Commons Attribution License (https://creativecommons.org/licenses/by/4.0), which permits unrestricted use, distribution, and reproduction in any medium, provided the original work is properly cited.
This article is published in open access under the Subscribe to Open model. This email address is being protected from spambots. You need JavaScript enabled to view it. to support open access publication.
1. Introduction
There is a broad range of observational evidence indicating the existence of magnetic fields in the Universe. Relatively strong fields residing in star systems and galaxies are believed to result from the amplification of seed fields with understood hypothetical magnetodynamos. In contrast, magnetic fields in cosmic voids have no apparent connection to astrophysical sources and support the idea of their cosmological origin (see reviews by Durrer & Neronov 2013; Subramanian 2016). They are called primordial magnetic fields (PMFs), and the experimental evidence for their existence follows from the observations of blazar radiation in GeV and TeV energy ranges by advanced gamma-ray telescopes (Neronov & Vovk 2010; Dolag et al. 2011; Takahashi et al. 2013; Tiede et al. 2020; Acciari et al. 2023). They give a lower limit on the value of such fields on scales of several megaparsecs: B0 > 10−20 G. There are a few methods of studying the magnetic fields at cosmological space-time scales, including Faraday rotation measurements (O’Sullivan et al. 2020; Neronov et al. 2024), magnetic fields’ impact on CMB (Paoletti et al. 2022), Ly-α forest method (Pavičević et al. 2025), dwarf galaxies studies (Sanati et al. 2024), studying high-z structures (Ralegankar et al. 2024), and line-intensity mapping (Adi et al. 2023). The upper limit follows from the study of the cosmic microwave background (CMB) anisotropy by the Planck Space Observatory (Planck Collaboration XIX 2016): B0 < 9 ⋅ 10−10 G.
The signals from the Dark Ages, when physical processes in the baryonic component with primordial chemistry were simplest, promise to unveil some puzzles of current cosmology related to primordial fields, the nature of dark matter particles, and others. Such signals are the 21 cm line of atomic hydrogen (see reviews Barkana & Loeb 2001; Fan et al. 2006; Furlanetto et al. 2006; Bromm & Yoshida 2011; Pritchard & Loeb 2012; Natarajan & Yoshida 2014; Shimabukuro et al. 2023; Minoda et al. 2023) and the ro-vibrational lines of the first molecules (Kamaya & Silk 2002; Ripamonti et al. 2002; Kamaya & Silk 2003; Omukai & Kitayama 2003; Mizusawa et al. 2004, 2005; Liu et al. 2019; Novosyadlyj et al. 2020, 2022; Maio et al. 2022). They manifest themselves as a weak distortion of the CMB spectrum. In this paper, we discuss the redshifted 21 cm signal in the decametre wavelength range.
The development of theoretical aspects regarding the dependence of the 21 cm signal from the early Universe on PMFs can be followed in papers (Sethi & Subramanian 2005; Tashiro & Sugiyama 2006; Schleicher et al. 2009; Kunze & Komatsu 2014; Chluba et al. 2015; Kunze 2019; Cruz et al. 2024; Bhaumik et al. 2025). They are mainly focused on the global signal at 50–100 MHz expected from the Cosmic Dawn epoch as the strongest one capable of being detected by current advanced antennas, such as EDGES (Bowman et al. 2018) and SARAS 3 (Singh et al. 2022), or power spectrum by array telescopes such as LOFAR1, MWA2, PAPER3, GMRT4 or HERA5.
In this paper we study the impact of primordial magnetic fields on the predicted 21 cm hydrogen line signal from the Dark Ages redshifted to the decametre range of electromagnetic waves 10–50 MHz. Due to magnetic field decay, there is additional heating of intergalactic gas. The goal is to establish the sensitivity range of this signal to the large-scale averaged amplitude and power spectrum index of PMFs. In previous papers (Novosyadlyj et al. 2023, 2024), we analysed the sensitivity of the Dark Ages global signal to the strength of nearly scale-invariant PMFs (nB = −2.9). In the paper by Konovalenko et al. (2024), it was shown that the sensitivities of ground-based Ukrainian array telescopes, UTR-2 and GURT, are enough to detect the redshifted 21 signal from the Dark Ages with integration time ∼60 days. The most promising ground-based array telescope for investigating the metre-decametre wavelength sky with the highest sensitivity and angular resolution is Square Kilometre Array6 (SKA), which will start observations in the coming years. Moreover, a few projects of far-side lunar telescopes aiming to detect this line are under development (Burns et al. 2011; Shkuratov et al. 2019; Bentum et al. 2020; Burns 2021; Goel et al. 2022; Bale et al. 2023). The Chinese low-frequency radio spectrometer7 Chang’E-4 is already in operation and is taking measurements. So detailed investigations of the 21 cm line from the Dark Ages, its dependence on parameters of cosmological models, and the existence of degeneracies between them are important tasks of current cosmology.
The plan of the paper is as follows. In Sect. 2, we describe the state of the intergalactic medium during the Dark Ages, from cosmological recombination up to the beginning of intensive reionisation at z = 10, in the ΛCDM cosmological models with different values of amplitude and power spectrum index of PMFs. In Sect. 3, we analyse the dependence of the position and profile of the 21 cm absorption line in the Dark Ages on cosmological parameters in the standard ΛCDM model and additional heating of the baryonic component in models with PMFs. The comparison of our results with analogical ones of other authors, discussions of disagreements and degeneracies are presented in Sect. 4. The results are summarised in Sect. 5.
2. Thermal history of the intergalactic medium in the Dark Ages
For the calculation of distortion of the CMB thermal spectrum at the redshifted 21 cm line in the Dark Ages epoch, it is necessary to compute the ionisation and thermal history of the gas, as well as the populations of levels of the hyperfine structure of atomic hydrogen. They depend on the parameters of the cosmological model, the ionisation mechanisms, heating, and cooling of the baryonic gas. In this section, we consider the ionisation and thermal history of the gas in the model with primordial magnetic fields and in the standard ΛCDM model for comparison. In all computations, we assume the cosmological parameters following from Planck Collaboration VI (2020): H0 = 67.36 ± 0.54 km/s ⋅ Mpc (Hubble constant), Ωb = 0.0493 ± 0.00112 (density parameter8 of baryonic matter), Ωdm = 0.266 ± 0.0084 (density parameter of dark matter), Ωr = 2.49 ⋅ 10−5 (density parameter of relativistic component (CMB and neutrinos)), ΩΛ = 0.6847 ± 0.0073, and ΩK = 0 (dimensionless9 cosmological constant Λ and curvature of 3-space K, respectively). We assume the primordial chemical composition with the mass fraction of helium Yp = 0.2446 (Peimbert et al. 2016), following from the cosmological nucleosynthesis of the standard Big Bang model.
After the epoch of cosmological recombination and before reionisation (800 ≲ z ≲ 10), more than 99% of hydrogen was in the neutral state. The residual ionisation of the Universe is a consequence of its expansion. The fraction of ionised hydrogen xHII is less than 1% at these redshifts and depends on the density, the mechanisms of heating and cooling of the gas, and the expansion rate of the Universe. For a homogeneous expanding Universe, the gas temperature and ionisation of atoms are calculated by integrating a system of differential equations describing energy balance and ionisation-recombination kinetics of atoms10. In the standard ΛCDM model, the main mechanism of gas heating in this period is Compton scattering of CMB radiation on free electrons and adiabatic cooling caused by cosmological expansion. All other heating and cooling mechanisms that occur in astrophysical plasma under Dark Ages conditions are significantly weaker (see Fig. 4 in Novosyadlyj et al. 2023).
In our computations, during cosmological recombination and in the epoch of the Dark Ages, the temperature of the plasma and the ionisation of hydrogen and helium up to z = 200 are calculated using an effective three-level atomic model implemented in the publicly available code RecFast11 (Seager et al. 1999, 2000). The calculation for z < 200 is by the numerical integration of the system of differential equations:
 (1)
(1)
 (2)
(2)
 (3)
(3)
 (4)
(4)
where Tb is the temperature of the baryonic gas; ntot ≡ nHI + nHII + ne + nHeI + nHeII + nHeIII is the number density of particles of all types; nH ≡ nHI + nHII is the number density of hydrogen; ne ≡ nHII + nHeII + 2nHeIII is the number density of electrons; xe ≡ ne/nH, xHI ≡ nHI/nH, xHII ≡ nHII/nH, xHeI ≡ nHeI/nHe, xHeII ≡ nHeII/nHe, kB is the Boltzmann constant; ΓCMB is the heating function due to Compton scattering of CMB quanta on free electrons (Seager et al. 1999, 2000); Λad is the adiabatic cooling function due to the expansion of the Universe (Seager et al. 1999); Λff is the cooling function due to free-free transitions of electrons (Shapiro & Kang 1987); Λphr is the cooling function due to photorecombination (Anninos et al. 1997); ΛH2 is the cooling function due to emission in rotational-vibrational transitions of the H2 molecule (Seager et al. 1999); Γpmf is the heating function caused by PMFs decaying; RHI, RHeI are the photoionisation rates of hydrogen and helium atoms; CHIi, CHeIi are the collisional ionisation coefficients of the i-th type of particles; αHII, αHeII are the recombination coefficients of hydrogen and helium ions; and Ωm = Ωb + Ωdm, H(z) is the expansion rate of the Universe. The reaction rates used here can be found in Appendix of Novosyadlyj et al. (2023).
We assume that the non-helical magnetic field in the Dark Ages is an isotropic and homogeneous random process, and the following equations by Mack et al. (2002), Sethi & Subramanian (2005), Kunze & Komatsu (2014), Chluba et al. (2015), Minoda et al. (2019) describe its statistical properties in terms of a power spectrum,
 (5)
(5)
where  is a Fourier component of Bi(x) with wave vector k and
 (6)
(6)
where nB is the spectral index,  is the Fourier mode of the smoothed field Bλ over scale λ. Magnetohydrodynamics of the baryon-photon plasma before recombination predicts the decay of magnetic fields at small scales. The smallest scale that survives is defined by the field strength, the dimensionless Alfvén velocity, and the baryon-photon Silk damping scale (Subramanian & Barrow 1998). The damping scale at the recombination epoch is as follows:
![Mathematical equation: $$ \begin{aligned} k_{\rm D}^{rec}&=\left[7.32\cdot 10^4\left(\frac{k_\lambda }{\mathrm{Mpc}^{-1}}\right)^{n_{\rm B}+3}\left(\frac{\omega _{\rm m}}{0.15}\right)^{\frac{1}{2}}\left(\frac{\omega _{\rm b}}{0.02}\right)\right. \\&\quad \times \left(\frac{x_{\rm e}^{rec}}{0.1}\right)\left.\left(\frac{1+z_{\rm rec}}{1100}\right)^{\frac{5}{2}}\left(\frac{\mathrm{nG}}{B_\lambda }\right)^2\left(\frac{h}{0.7}\right)^2\right]^{\frac{1}{n_{\rm B}+5}} \, \mathrm{Mpc}^{-1},\nonumber \end{aligned} $$](/articles/aa/full_html/2026/02/aa55984-25/aa55984-25-eq9.gif) (7)
(7)
where ωi ≡ Ωih2 and  is the fraction of free electrons at the time of recombination zrec. The justification for this expression is given in Appendix A. At any time after recombination, the evolution of the damping scale is presented as
  , where we obtain fD(z) by integrating the energy conservation equation for PMFs:
 (8)
(8)
simultaneously with Eqs. (1)–(4). In this equation, the first term on the right-hand side describes the adiabatic decay of the PMFs’ energy density caused by expansion of the Universe ( ), and where
  is the dissipation rate of the PMFs’ energy density in the post-recombination plasma due to the decaying magnetic turbulence and ambipolar diffusion. We set the initial condition for fD(zrec) = 1.
In such an approach, the magnetic field strength B(z), smoothed at a scale λ at any redshift z, is given as follows (Minoda et al. 2019):
 (9)
(9)
We note BλDad(z)≡B0 ⋅ (1 + z)2, where λD = 2π/kD. Then the energy density of the PMFs at any z is
 (10)
(10)
So, the factor fDnB + 3 describes the over-adiabatic decay of PMFs caused by heating the slightly ionised plasma after recombination. The often-used strength of smoothed PMFs on the scale of λ = 1 Mpc is related to B0 as  . So, for λD < 1 Mpc, B1 Mpc < B0 and decreases with increasing nB.
The decay of magnetic fields leads to the heating of baryonic matter, affecting the thermal and ionisation history of the Universe in the Dark Ages. Two mechanisms of heating of baryonic matter are considered: decaying magnetic turbulence and ambipolar diffusion. Taking into account the results in Mack et al. (2002), Sethi & Subramanian (2005), Chluba et al. (2015), Kunze & Komatsu (2014), Minoda et al. (2019), the dependence of the corresponding heating functions on redshift can be represented as follows:
![Mathematical equation: $$ \begin{aligned} \Gamma _{\rm pmf}^\mathrm{(dt)}(z\ge z_{\rm rec})&= 1.5\rho _{\rm mf}^{ad}H(z)\frac{w_{\rm B}}{a}[f_{\rm D}(z)]^{n_{\rm B}+3}\nonumber \\&\quad \times \exp \left\{ -\frac{(z-z_{\rm rec})^2}{5000}\right\} \left(\frac{1+z_{\rm rec}}{1+z}\right)^4,\end{aligned} $$](/articles/aa/full_html/2026/02/aa55984-25/aa55984-25-eq18.gif) (11)
(11)
![Mathematical equation: $$ \begin{aligned} \Gamma _{\rm pmf}^\mathrm{(dt)}(z < z_{\rm rec})&= 1.5\rho _{\rm mf}^{ad}H(z)[f_{\rm D}(z)]^{n_{\rm B}+3}\nonumber \\&\quad \times \frac{w_{\rm B}a^{w_{\rm B}}}{(a+1.5\ln ((1+z_{\rm rec})/(1+z)))^{w_{\rm B}+1}},\end{aligned} $$](/articles/aa/full_html/2026/02/aa55984-25/aa55984-25-eq19.gif) (12)
(12)
![Mathematical equation: $$ \begin{aligned} \Gamma _{\rm pmf}^\mathrm{(amd)}(z)&= \frac{1-x_{\rm HII}}{g(T_{\rm b})x_{\rm HII}}[f_{\rm D}(z)]^{2n_{\rm B}+8}\nonumber \\&\quad \times \left[\frac{(1+z)k_{\rm D}^{rec}}{3.086\cdot 10^{24}}\frac{\rho _{\rm mf}^{ad}}{\rho _{\rm b}}\right]^2f_{\rm L}, \end{aligned} $$](/articles/aa/full_html/2026/02/aa55984-25/aa55984-25-eq20.gif) (13)
(13)
where [Γ]=erg/cm3/s, zrec = 1088, and trec are the redshift and time of cosmological recombination accordingly; a = ln(1 + td/trec), wB ≡ 2(nB + 3)/(nB + 5), td/trec = 14.8/(B0kD), and  is the baryonic matter density;
  cm3/s/g, and fL = 0.8313(nB + 3)1.105(1.0 − 0.0102(nB + 3)) is the analytic approximation of the Lorentz force integral (Chluba et al. 2015).
With regard to the value of the spectral index nB, there are no strong theoretical constraints placed on it. In fact, the spectral index serves as the major discriminating factor among the generation mechanisms of primordial magnetic fields, given that different mechanisms inherently produce fields with different values of the spectral index. A variety of hypothetical generation mechanisms during the inflation epoch are considered in the literature; almost all of them introduce extra non-standard fields and/or interactions. Some of them include coupling of electromagnetic field to scalar fields, such as inflaton or dilaton (Subramanian 2010; Bamba & Yokoyama 2004; Durrer et al. 2023); coupling to space-time curvature (Kushwaha & Shankaranarayanan 2020); generation in Higgs-Starobinsky inflation (Durrer et al. 2022); coupling to axion-type fields (Adshead et al. 2015); introducing an extra-dimensional scale factor (Kunze 2005); and considering spatial anisotropy in the background metric (Pal et al. 2024). There is also a possibility of magnetic field generation during phase transitions of the Universe. Scientists have done a lot of work to study this scenario, while the results for generated magnetic fields and spectral indices are strongly model dependent (Vachaspati 2021). Finally, there are some models with primordial black holes that allow late field generation after primordial nucleosynthesis (Saga et al. 2020; Papanikolaou & Gourgouliatos 2023).
Nevertheless, we want to consider values of nB that could be detectable with other observational methods. To be observable with current Planck constraints from CMB anisotropy, for example, the spectral index should not exceed the range nB ≃ 1 − 2 (Planck Collaboration XIX 2016). However, it should be noted that there is still a possibility that the true value of the spectral index is higher than this (Durrer & Caprini 2003). For this reason, we are interested in the range of nB ∈ [ − 2.9, +4] and B0 ∈ [0.05, 0.5] nG. The expression for the heating function via ambipolar diffusion (13) is correct in the range of spectral index −3 ≤ nB ≤ 5 (Kunze & Komatsu 2014).
In Fig. 1, we present fD(z) in power nB + 3 for different nB = −2.9, … 4. It depends on the amplitude of the magnetic field very weakly, therefore, we show it only for B0 = 0.5 nG. The curves also illustrate the decrease in the PMFs’ energy density caused by decaying magnetic turbulence and ambipolar diffusion over and above the adiabatic losses due to the expansion of the Universe:  . They decrease when nB increases to ∼ − 1, then slightly increase to some approximant curve as the spectral index continues to grow. We explain this by the fact that the power spectrum ∝knB with damping scale kD becomes similar to the delta-function when nB → +∞.
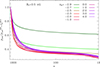 |
Fig. 1. Time evolution of PMFs’ cut-off scale caused by decaying magnetic turbulence and ambipolar diffusion ( |

In Fig. 2, we show the dependencies of heating functions caused by decaying magnetic turbulence and ambipolar diffusion on redshift in models with different values of B0 and nB. Both increase with increasing B0. But the first one weakly depends on the value of nB, while the heating function caused by ambipolar diffusion quickly increases with increasing nB. Nevertheless, ambipolar diffusion at z > 100 makes a negligible contribution to baryonic gas heating compared to the decay of field turbulence  , but it is comparable and large at lower z. In the inset of the right panel of Fig. 2, the ratios
  are presented to illustrate the change in the dependencies of
  on nB in the redshift range 300 ≤ z ≤ 50, and the existence of an approximant curve for
  for nB > 0. We also note that an approximant curve exists for
  as well (right panel). The apparent convergence of the curves in the left panel is illusory, due to the logarithmic scale.
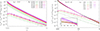 |
Fig. 2. Heating functions caused by decaying magnetic turbulence (solid lines) and ambipolar diffusion (dashed lines) in PMFs models with different B0 (left) and nB (right). The inset panel shows |

In Fig. 3, we show the dependencies of the ionised fraction of hydrogen on redshift during the Dark Ages for PMF models with different values of B0 in the range 0.05–0.5 nG and nB = −2.9. They differ only slightly from xHII(z) in the standard ΛCDM since the heating of the gas in the PMF models with B0 = 0.5 and nB = −2.9 does not exceed 1.3TCMB (see Figs. below). Helium remains completely neutral, so xe = xHII.
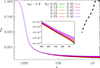 |
Fig. 3. Dependence of ionised hydrogen fraction on redshift in models with primordial stochastic magnetic fields with different values of B0, which increases for lines from bottom to top. The dashed line is the 2σ upper limit from the CMB radiation polarization data (Planck Collaboration VI 2020). |
The results of integrations of the system of equations, (1)–(4) with (11)–(13), are presented in Fig. 4 for the models with different root mean square values of field strength B0 = 0.05 − 0.5 nG and nB = −2.9 (left panel), and for different values of nB = −2.9 … 4 and B0 = 0.5 nG (right panel). One can see that PMFs with B0 ≥ 0.05 nG noticeably increase the temperature of baryonic matter at z < 300 in comparison with temperature in the null field model. If B0 ≳ 0.35 − 0.40 nG and nB = −2.9, then the temperature Tb throughout the Dark Ages epoch is higher than the temperature of the CMB. Increasing nB for the same values of B0 and z causes a non-monotonic increase of the temperature amplitude that we see in the inset of the right panel of Fig. 4, where the ratios Tb(z, B0, nB)/TCMB(z) are shown. This behaviour is caused by the dependence of  on z shown in the inset of Fig. 2. The baryon temperature is an integral of
  on z, which explains their different dependencies on z, but similar ones on nB.
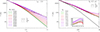 |
Fig. 4. Evolution of baryonic matter temperature Tb (solid lines) and spin temperature Ts (dotted lines) from cosmological recombination up to z = 10 in ΛCDM model with PMF with different B0 (left panel) and with different values of spectral indices nB (right panel). The dashed line in both panels shows the temperature of CMB. The inset in the right panel shows Tb(z, B0, nB)/Tb(z, B0, nB = −2.9) for the purpose of distinguishing lines in the 21 cm line formation region. |
3. Global signal in 21 cm line: sensitivity to primordial magnetic field parameters
In this section, we analyse the dependence of the global signal in the 21 cm hydrogen line on PMF parameters. We have shown in previous papers (Novosyadlyj et al. 2023, 2024) that this line is noticeably sensitive to the heating of the intergalactic medium by PMFs when its amplitude is ≳0.1 nG and nB = −2.9. For lower B0, the global signal is an absorption line with differential brightness temperature δTbr ≈ −41 mK at frequency ≈16 MHz and the effective width of the line ≈25 MHz as in the standard ΛCDM model12. With increasing B0, the depth of the absorption line decreases, disappears, and becomes an emission line at B0 ≈ 0.3 nG. In those papers, we supposed a nearly scale-invariant power spectrum of PMF with nB = −2.9. Since there are no observable constraints for the spectral index, it is sound to analyse the dependence of the brightness temperature in the line δTbr on nB too.
Thus, we computed the evolution of the baryonic gas temperature Tb and the fraction of neutral hydrogen xHI according to the prescription of Sect. 2: the excitation or spin temperature Ts and the differential brightness temperature δTbr as the solutions of the kinetic equations of excitation – de-excitation of hyperfine structure levels and radiation transfer equations accordingly,
![Mathematical equation: $$ \begin{aligned} \delta T_{\rm br}(z)&=0.144 x_{\rm HI} \frac{\Omega _{\rm b}h}{\Omega _{\rm m}^{1/2}} (1+z)^{1/2} \left[1-\frac{T_{\rm CMB}}{T_{\rm s}}\right]\,\mathrm{K},\end{aligned} $$](/articles/aa/full_html/2026/02/aa55984-25/aa55984-25-eq33.gif) (14)
(14)
 (15)
(15)
where A10 is the Einstein spontaneous transition coefficient for the excited hyperfine structure level; C10 is its collisional deactivation rate by electrons, protons, and neutral hydrogen atoms; ν21 = 1420 MHz is the rest frame frequency of the 21 cm line; hP and kB are Planck and Boltzmann constants accordingly. The total collisional deactivation rate C10 depends on the temperature of the gas, the number densities of neutral hydrogen, protons, and electrons. It is crucial in the computation of the collisional coupling coefficient xc, which defines the spin temperature. The evolution of xc in the ΛCDM model with PMFs is shown in Fig. 5. It explains the evolution of the spin temperature Ts shown in Fig. 4 by dotted lines. The relation between Ts and TCMB at any z defines the differential brightness temperature δTbr(z), which follows from Eq. (14). When Ts → TCMB, then δTbr(z)→0. At z > 400, the coupling coefficients are xc ≫ 1 and Ts → Tb. But there Tb ≈ TCMB, so δTbr(z)→0 again.
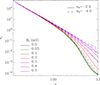 |
Fig. 5. Dependencies of collisional coupling xc on redshift in the models ΛCDM+PMF with different values of B0 and nB. |
We computed the brightness temperature in the 21 cm hydrogen line using expressions (14)–(15) for the same values of cosmological parameters and PMFs as in the previous section. The results are presented in Fig. 6 for different values of field strength B0 = 0.05 … 0.5 nG, and in Fig. 7 for different values of spectral index nB = −2.9 … 4.0.
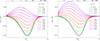 |
Fig. 6. Global signal in hydrogen 21 cm line for PMF models with nB = −2.9 (left panel) and nB = 4 (right panel), with different values of B0 (coloured lines). |
The results presented in Fig. 6 illustrate the dependence of the line profile on field strength, the transition from the absorption line to the emission line with increasing B0. Fig. 7 shows that the global signal in the 21 cm hydrogen line is also sensitive to the value of the spectral index nB. In Fig. 8 we show the dependence of the amplitude of 21 cm line,  , on nB for models with B0= 0.1 and 0.5 nG. We note some non-monotonic dependence of spectral feature amplitude on nB in the range −2.9 ≤ nB ≤ −2 for models with B0 = 0.5 nG.
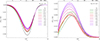 |
Fig. 7. Global signal in hydrogen 21 cm line for PMF models with B0 = 0.1 nG (left panel) and B0 = 0.5 nG (right panel), with different values of nB (coloured lines). |
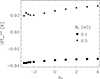 |
Fig. 8. Dependence of amplitude of 21 cm line |

In the paper Okamatsu et al. (2024), the authors propose using the high-frequency wing of the Dark Ages 21 cm line, especially the relation between two ratios
as a measure of the deviations of the cosmological models from the standard ΛCDM one and the possible distinction of them. In Fig. 9 we present the relation |R20/30|−|R40/30| for all profiles in Figs. 6–7. One can see that all ΛCDM+PMF models deviate from the ΛCDM one mainly along the diagonal |R40/30|max − R20/30|max, similar to other models in Okamatsu et al. (2024) (Fig. 4), but the spreads for the models analysed here are wider.
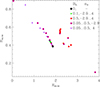 |
Fig. 9. Profiles of 21 cm lines in different (B0, nB) models of PMFs in the space R20/30 − R40/30. |
4. Comparison and discussions
Let us compare our results with similar ones recently published by other authors, in particular Minoda et al. (2019), Okamatsu et al. (2024), Mohapatra et al. (2024). First, we note that the evolution of baryonic gas temperature and the 21 cm signal during the Dark Ages in the ΛCDM model with close parameters is practically the same as in these and other papers cited here. Comparison of results for PMFs models is not so unambiguous due to the authors’ use of different approximations in calculations of decaying turbulence and ambipolar diffusion, the cut-off scale of the magnetic field at the time of recombination, taking into account its changes over time during the Dark Ages, and so on. In this paper, we completely describe the PMFs model and all the parameters and approximations used in the calculations. We even provide in Appendix A the derivation of the dependence of kD on the cosmological parameters, since it is different from paper to paper.
In PMF models with nB = −2.9 and B0 = 0.1, 0.2, 0.5 nG, Minoda et al. (2019) obtained baryonic temperature Tb at z = 10, approximately 4, 10, and 50 K (see Fig. 1 in Minoda et al. 2019). Our values in the left panel of Fig. 4 are 4, 8, 37 K accordingly. The small differences are caused by the small differences in the parameters of the fiducial cosmological models and  . Mohapatra et al. (2024) obtained Tb with the same
  at z = 10 ∼4, 10, and 30 K for PMF models with nB = −2.99 and B0 = 0.1, 0.3, 0.55 nG respectively (see Fig. 3a in Mohapatra et al. 2024). So, we can conclude that for an almost scale-invariant spectrum, the results are close.
But if we compare our results for nB = −2.5 and B0 = 0.1, 0.3 nG with those corresponding to Mohapatra et al. (2024) (Fig. 3a), then we see a strong disagreement despite the same expressions for  and
and  . Their results show a steep increase in Tb with a small increase in nB, while our results show a slow increase in Tb (and δTbr, Fig. 8) with nB. The authors in Mohapatra et al. (2024) did not explain such behaviour. This may be the case if the heating due to ambipolar diffusion is overestimated by several orders of magnitude, as can be assumed on the basis of Fig. 2.
Comparing the profiles of the redshifted 21 cm line from the Dark Ages in the PMF models (Fig. 6) with profiles in the models with self-annihilating and decaying dark matter particles (see Fig. 12 in Novosyadlyj et al. 2024), one can see the similarities between them. It means that other signals from the Dark Ages must be used, together with the 21 cm hydrogen line redshifted to decametre wavelengths, to constrain the parameters of PMFs and decaying dark matter. These can be signals in the ro-vibrational lines of the first molecules (Novosyadlyj et al. 2025; Kulinich & Novosyadlyj 2025), the Cosmic Dawn 21 cm line redshifted to metre wavelengths (Sethi & Subramanian 2005; Tashiro & Sugiyama 2006; Schleicher et al. 2009; Kunze & Komatsu 2014; Chluba et al. 2015; Kunze 2019; Cruz et al. 2024; Bhaumik et al. 2025), Faraday rotation measurements (O’Sullivan et al. 2020), magnetic fields’ impact on CMB (Paoletti et al. 2022), Ly-α forest method (Pavičević et al. 2025) and so on.
Last but not least, the question is about the possibility of detecting the impact of PMFs on the 21 cm signal formed in the Dark Ages. It was mentioned in the Introduction that detection of the 21 cm signal from the Dark Ages needs about 1500 hours of integration time by ground-based Ukrainian radio telescope UTR-2 (Konovalenko et al. 2024). Nevertheless, observations in the ∼10 − 50 MHz band are particularly challenging, as the 21 cm signal from the Dark Ages is strongly contaminated by several sources of foreground.
First, artificial, human-made sources, such as short-wave broadcasting, aviation communication, and amateur radio, produce radio frequency interferences that are many orders of magnitude stronger than the cosmological signal. Second, the ionosphere contributes a strong, time-dependent foreground that varies with the time of day. Third, our Galaxy emits synchrotron and bremsstrahlung radiation at these wavelengths, which constitutes a foreground with temperatures in order of 103 − 104 K.
Recently proposed missions, such as DAPPER (Burns et al. 2011) and FARSIDE (Burns et al. 2021), designed to operate from the far side of the Moon, will be largely shielded from the first two sources of contamination. In contrast, the Galactic synchrotron foreground, unlike the cosmological 21 cm signal, is polarised and exhibits a distinctive spatial structure, allowing for its effective removal through foreground subtraction techniques. Moreover, the spectral density of the galactic foreground is well described by the power-law frequency dependence (see, e.g., Furlanetto et al. 2006).
Interestingly, the non-detection of the 21 cm absorption line from the Dark Ages at z ≃ 100 may allow us to put an upper limit on the strength and spectral index of PMFs, if we overcome the degeneracy with alternative non-standard heating sources, for example, decaying or self-annihilating dark matter. We estimated that ∼3600 hours of FARSIDE integration time would be sufficient to place an upper limit 0.1 nG on the magnetic field strength for nB = −2.9 or nB = 4.0 (see Appendix B for details). With 10 000 hours of integration time, we will be able to detect even the 21 cm absorption signal in the scenarios with B0 ≃ 0.2 nG. Moreover, within such an integration time it is possible to find signatures of the 21 cm emission for frequencies near 10 MHz (z ≃ 100) in the scenarios with B0 = 0.5 nG and nB = 4.0.
5. Conclusions
We analysed the impact of primordial magnetic fields on the thermal history of the Universe in the Dark Ages due to the decaying magnetic turbulence and ambipolar diffusion in low-ionised plasma, and showed that fields with B0 ≥ 0.05 nG reduce the depth of the 21 cm absorption line of the standard ΛCDM model, in which the brightness temperature in line is δTbr ≈ −40 mK at frequency ≈16 MHz and the effective width ≈25 MHz. At B0 ∼ 0.25 − 0.3 nG, the absorption line becomes the emission line in the low-frequency wing of the absorption line. In models with nB = −2.9 and 0.05 ≤ B0 ≤ 0.5 nG, the amplitude of the absorption/emission line ranges from −40 to +20 mK in the frequency range of 16 − 8 MHz, the width at half-maximum 25 − 20 MHz. Thus, the global signal in the 21 cm line from the Dark Ages is sensitive to PMFs with a nearly scale-invariant power spectrum nB = −2.9 when B0 ≳ 0.05 nG.
We found a sensitivity of the amplitude and profile shape of the 21 cm hydrogen spectral line formed during the Dark Ages to the value of the spectral index nB at fixed values of the field strength B0. As nB increases from –2.9 to 4.0 in the case of PMFs with B0 = 0.1 nG, the absorption line becomes shallower from –35 to –32 mK at the same frequency ∼16 MHz. In the case of PMFs with B0 = 0.5 nG, the amplitude of the emission line increases from ∼20 to ∼30 mK. Comparisons with other gas-heating mechanisms in models outside the standard ΛCDM model revealed similarities in profiles with the decaying dark matter model, indicating the need to use other signals from the early Universe to resolve this degeneracy.
Acknowledgments
This work is carried out within the framework of the project “Tomography of the Dark Ages and Cosmic Dawn in the lines of hydrogen and the first molecules as a test of cosmological models” (state registration number 0124U004029) supported by the National Research Found of Ukraine.
References
- Acciari, V. A., Agudo, I., Aniello, T., et al. 2023, A&A, 670, A145 [NASA ADS] [CrossRef] [EDP Sciences] [Google Scholar]
- Adi, T., Libanore, S., Cruz, H. A. G., & Kovetz, E. D. 2023, JCAP, 2023, 035 [CrossRef] [Google Scholar]
- Adshead, P., Giblin, J. T., Jr., Scully, T. R., & Sfakianakis, E. I. 2015, JCAP, 2015, 034 [CrossRef] [Google Scholar]
- Anninos, P., Zhang, Y., Abel, T., & Norman, M. L. 1997, New Astron., 2, 209 [CrossRef] [Google Scholar]
- Bale, S. D., Bassett, N., Burns, J. O., et al. 2023, arXiv e-prints [arXiv:2301.10345] [Google Scholar]
- Bamba, K., & Yokoyama, J. 2004, Phys. Rev. D, 69, 043507 [Google Scholar]
- Barkana, R., & Loeb, A. 2001, Phys. Rep., 349, 125 [NASA ADS] [CrossRef] [Google Scholar]
- Bentum, M. J., Verma, M. K., Rajan, R. T., et al. 2020, Adv. Space Res., 65, 856 [NASA ADS] [CrossRef] [Google Scholar]
- Bhaumik, A., Paul, D., & Pal, S. 2025, JCAP, 2025, 089 [Google Scholar]
- Bowman, J. D., Rogers, A. E. E., Monsalve, R. A., Mozdzen, T. J., & Mahesh, N. 2018, Nature, 555, 67 [Google Scholar]
- Bromm, V., & Yoshida, N. 2011, ARA&A, 49, 373 [CrossRef] [Google Scholar]
- Burns, J. O. 2021, Philos. Trans. R. Soc. Lond. Ser. A, 379, 20190564 [Google Scholar]
- Burns, J. O., Lazio, J., Bowman, J., et al. 2011, AAS Meet. Abstr., 217, 107.09 [Google Scholar]
- Burns, J., Hallinan, G., Chang, T. C., et al. 2021, arXiv e-prints [arXiv:2103.08623] [Google Scholar]
- Chluba, J., Paoletti, D., Finelli, F., & Rubiño-Martín, J. A. 2015, MNRAS, 451, 2244 [Google Scholar]
- Condon, J. J., & Ransom, S. M. 2016, Essential Radio Astronomy (Princeton University Press) [Google Scholar]
- Cruz, H. A. G., Adi, T., Flitter, J., Kamionkowski, M., & Kovetz, E. D. 2024, Phys. Rev. D, 109, 023518 [Google Scholar]
- Dolag, K., Kachelriess, M., Ostapchenko, S., & Tomàs, R. 2011, ApJ, 727, L4 [NASA ADS] [CrossRef] [Google Scholar]
- Durrer, R., & Caprini, C. 2003, JCAP, 2003, 010 [CrossRef] [Google Scholar]
- Durrer, R., & Neronov, A. 2013, A&ARv, 21, 62 [NASA ADS] [CrossRef] [Google Scholar]
- Durrer, R., Sobol, O., & Vilchinskii, S. 2022, Phys. Rev. D, 106, 123520 [Google Scholar]
- Durrer, R., Sobol, O., & Vilchinskii, S. 2023, Phys. Rev. D, 108, 043540 [Google Scholar]
- Fan, X., Carilli, C. L., & Keating, B. 2006, ARA&A, 44, 415 [Google Scholar]
- Furlanetto, S. R., Oh, S. P., & Briggs, F. H. 2006, Phys. Rep., 433, 181 [Google Scholar]
- Goel, A., Pisanti, D., Mcgarey, P., et al. 2022, AAS Meet. Abstr., 240, 312.06 [Google Scholar]
- Hu, W., & White, M. 1997, ApJ, 479, 568 [Google Scholar]
- Kaiser, N. 1983, MNRAS, 202, 1169 [NASA ADS] [Google Scholar]
- Kamaya, H., & Silk, J. 2002, MNRAS, 332, 251 [NASA ADS] [CrossRef] [Google Scholar]
- Kamaya, H., & Silk, J. 2003, MNRAS, 339, 1256 [NASA ADS] [CrossRef] [Google Scholar]
- Konovalenko, A., Zakharenko, V., Novosyadlyj, B., et al. 2024, J. Phys. Stud., 28, 1902 [Google Scholar]
- Kulinich, Y., & Novosyadlyj, B. 2025, A&A, 698, A32 [NASA ADS] [CrossRef] [EDP Sciences] [Google Scholar]
- Kunze, K. E. 2005, Phys. Lett. B, 623, 1 [Google Scholar]
- Kunze, K. E. 2019, JCAP, 2019, 033 [Google Scholar]
- Kunze, K. E., & Komatsu, E. 2014, JCAP, 2014, 009 [Google Scholar]
- Kushwaha, A., & Shankaranarayanan, S. 2020, Phys. Rev. D, 102, 103528 [Google Scholar]
- Liu, B., Jaacks, J., Finkelstein, S. L., & Bromm, V. 2019, MNRAS, 486, 3617 [NASA ADS] [CrossRef] [Google Scholar]
- Mack, A., Kahniashvili, T., & Kosowsky, A. 2002, Phys. Rev. D, 65, 123004 [Google Scholar]
- Maio, U., Péroux, C., & Ciardi, B. 2022, A&A, 657, A47 [NASA ADS] [CrossRef] [EDP Sciences] [Google Scholar]
- Minoda, T., Tashiro, H., & Takahashi, T. 2019, MNRAS, 488, 2001 [Google Scholar]
- Minoda, T., Saga, S., Takahashi, T., et al. 2023, PASJ, 75, S154 [Google Scholar]
- Mizusawa, H., Nishi, R., & Omukai, K. 2004, PASJ, 56, 487 [NASA ADS] [Google Scholar]
- Mizusawa, H., Omukai, K., & Nishi, R. 2005, PASJ, 57, 951 [NASA ADS] [Google Scholar]
- Mohapatra, V., Nayak, A. C., & Natwariya, P. K. 2024, Phys. Rev. D, 110, 123506 [Google Scholar]
- Natarajan, A., & Yoshida, N. 2014, Prog. Theor. Exp. Phys., 2014, 06B112 [Google Scholar]
- Neronov, A., & Vovk, I. 2010, Science, 328, 73 [NASA ADS] [CrossRef] [Google Scholar]
- Neronov, A., Vazza, F., Mtchedlidze, S., & Carretti, E. 2024, arXiv e-prints [arXiv:2412.14825] [Google Scholar]
- Novosyadlyj, B., Shulga, V., Kulinich, Y., & Han, W. 2020, ApJ, 888, 27 [Google Scholar]
- Novosyadlyj, B., Kulinich, Y., Melekh, B., & Shulga, V. 2022, A&A, 663, A120 [NASA ADS] [CrossRef] [EDP Sciences] [Google Scholar]
- Novosyadlyj, B., Kulinich, Y., Milinevsky, G., & Shulga, V. 2023, MNRAS, 526, 2724 [Google Scholar]
- Novosyadlyj, B., Kulinich, Y., & Konovalenko, O. 2024, J. Phys. Stud., 28, 1901 [Google Scholar]
- Novosyadlyj, B., Kulinich, Y., & Koval, D. 2025, Phys. Rev. D, 111, 083514 [Google Scholar]
- Okamatsu, F., Minoda, T., Takahashi, T., Yamauchi, D., & Yoshiura, S. 2024, Phys. Rev. Lett., 133, 131001 [Google Scholar]
- Omukai, K., & Kitayama, T. 2003, ApJ, 599, 738 [NASA ADS] [CrossRef] [Google Scholar]
- O’Sullivan, S. P., Brüggen, M., Vazza, F., et al. 2020, MNRAS, 495, 2607 [Google Scholar]
- Pal, S., Maity, D., & Do, T. Q. 2024, Phys. Rev. D, 109, 083507 [Google Scholar]
- Paoletti, D., Chluba, J., Finelli, F., & Rubiño-Martín, J. A. 2022, MNRAS, 517, 3916 [NASA ADS] [CrossRef] [Google Scholar]
- Papanikolaou, T., & Gourgouliatos, K. N. 2023, Phys. Rev. D, 107, 103532 [NASA ADS] [CrossRef] [Google Scholar]
- Pavičević, M., Iršič, V., Viel, M., et al. 2025, Phys. Rev. Lett., 135, 071001 [Google Scholar]
- Peebles, P. J. E., & Yu, J. T. 1970, ApJ, 162, 815 [NASA ADS] [CrossRef] [Google Scholar]
- Peimbert, A., Peimbert, M., & Luridiana, V. 2016, Rev. Mex. Astron. Astrofis., 52, 419 [NASA ADS] [Google Scholar]
- Planck Collaboration XIX. 2016, A&A, 594, A19 [NASA ADS] [CrossRef] [EDP Sciences] [Google Scholar]
- Planck Collaboration VI. 2020, A&A, 641, A6 [NASA ADS] [CrossRef] [EDP Sciences] [Google Scholar]
- Pritchard, J. R., & Loeb, A. 2012, Rep. Progr. Phys., 75, 086901 [CrossRef] [Google Scholar]
- Ralegankar, P., Pavičević, M., & Viel, M. 2024, JCAP, 2024, 027 [Google Scholar]
- Ripamonti, E., Haardt, F., Ferrara, A., & Colpi, M. 2002, MNRAS, 334, 401 [NASA ADS] [CrossRef] [Google Scholar]
- Saga, S., Tashiro, H., & Yokoyama, S. 2020, J. Cosmol. Astropart. Phys., 2020, 039 [CrossRef] [Google Scholar]
- Sanati, M., Martin-Alvarez, S., Schober, J., et al. 2024, A&A, 690, A59 [NASA ADS] [CrossRef] [EDP Sciences] [Google Scholar]
- Schleicher, D. R. G., Banerjee, R., & Klessen, R. S. 2009, ApJ, 692, 236 [Google Scholar]
- Seager, S., Sasselov, D. D., & Scott, D. 1999, ApJ, 523, L1 [NASA ADS] [CrossRef] [Google Scholar]
- Seager, S., Sasselov, D. D., & Scott, D. 2000, ApJS, 128, 407 [NASA ADS] [CrossRef] [Google Scholar]
- Sethi, S. K., & Subramanian, K. 2005, MNRAS, 356, 778 [NASA ADS] [CrossRef] [Google Scholar]
- Shapiro, P. R., & Kang, H. 1987, ApJ, 318, 32 [Google Scholar]
- Shimabukuro, H., Hasegawa, K., Kuchinomachi, A., Yajima, H., & Yoshiura, S. 2023, PASJ, 75, S1 [Google Scholar]
- Shkuratov, Y. G., Konovalenko, A. A., Zakharenko, V. V., et al. 2019, Acta Astronaut., 154, 214 [Google Scholar]
- Silk, J. 1968, ApJ, 151, 459 [NASA ADS] [CrossRef] [Google Scholar]
- Singh, S., Jishnu, N. T., Subrahmanyan, R., et al. 2022, Nat. Astron., 6, 607 [NASA ADS] [CrossRef] [Google Scholar]
- Subramanian, K. 2010, Astron. Nachr., 331, 110 [Google Scholar]
- Subramanian, K. 2016, Rep. Progr. Phys., 79, 076901 [CrossRef] [Google Scholar]
- Subramanian, K., & Barrow, J. D. 1998, Phys. Rev. D, 58, 083502 [Google Scholar]
- Takahashi, K., Mori, M., Ichiki, K., Inoue, S., & Takami, H. 2013, ApJ, 771, L42 [Google Scholar]
- Tashiro, H., & Sugiyama, N. 2006, MNRAS, 372, 1060 [Google Scholar]
- Tiede, P., Broderick, A. E., Shalaby, M., et al. 2020, ApJ, 892, 123 [NASA ADS] [CrossRef] [Google Scholar]
- Vachaspati, T. 2021, Rep. Progr. Phys., 84, 074901 [Google Scholar]
Density parameter is the mean density of the component in the current epoch in units of critical density: Ωi ≡ ρi0/ρcr0 where ρcr0 ≡ 3H02/8πG.
ΩΛ ≡ c2Λ/3H02, ΩK ≡ −c2K/H02.
The first molecules make up a small fraction of all particles (see Novosyadlyj et al. 2020, 2022) and are not discussed here in the context of ionisation history.
In the papers Novosyadlyj et al. (2023, 2024), the amplitude of δTbr in the ΛCDM is cited as ≈ − 35 mK by number 23 instead of 27 in the expression for δTbr.
Appendix A: Damping scale of PMFs at the recombination epoch
The damping scale of PMFs at the recombination epoch is defined in Subramanian & Barrow (1998) as
 (A.1)
(A.1)
where the magnetohydrodynamic Alfen velocity in units of light velocity at this epoch, according to Kunze & Komatsu (2014), equals
 (A.2)
(A.2)
and baryon-photon Silk damping scale (Silk 1968; Peebles & Yu 1970; Kaiser 1983):
 (A.3)
(A.3)
This approximation agrees well with the approximation proposed in Hu & White (1997). So,
 (A.4)
(A.4)
From this equation, we obtain the damping scale of PMFs (7) at the epoch of cosmological recombination.
Appendix B: Sensitivity of lunar radio-telescopes to the impact of PMFs on 21 cm signal
We consider the FARSIDE mission (Burns et al. 2021), proposed to operate for frequencies ν ≤ 40 MHz, as a case study to evaluate the potential of constraining primordial magnetic field (PMF) parameters through observations of the 21 cm signal from the Dark Ages. The thermal noise of an ideal radiometer at frequency ν is given by (Condon & Ransom 2016):
 (B.1)
(B.1)
where Tsys(ν) is the system temperature, approximately equal to the foreground temperature Tfg, N is the number of antennas operating in autocorrelation mode, Δν is the bandwidth, and t is the integration time. The foreground emission can be modelled as a power law:
following Burns et al. (2021); see also (Furlanetto et al. 2006). The FARSIDE mission concept includes 128 antennas with a bandwidth of Δν = 0.5 MHz.
Detecting a ∼10−2 K signal against a foreground with Tfg ∼ 103–104 K is extremely challenging. A pragmatic strategy is to focus on identifying the extrema of the global absorption or emission profile (private communication with Y. Vasylkyvskyi, Institute of Radio Astronomy, NAS of Ukraine). Assuming a signal-to-noise ratio of SNR ≥ 10, we estimate that detecting the 21 cm Dark Age signal in the absence of PMFs requires at least 1800 hr of integration. With 5000 hr integration time, FARSIDE could potentially detect the absorption signal predicted in a cosmological scenario with nB = −2.9 (nB = 4.0) and B = 0.2 nG (B0 = 0.15 nG). By contrast, detecting the 21 cm emission from z ≃ 200 at ν ≃ 6 MHz in the case of a non-helical magnetic field with B0 = 0.5 nG and nB = −2.0 (see Fig. 7-8) would require roughly 55 000 hr, corresponding to more than six years of continuous observations.
In addition, for scenarios with nB = 4.0 and B0 = 0.3 nG, where the signal exhibits two regimes, emission at z ∼ 200, and absorption at z ≲ 100, the FARSIDE array can detect the absorption signal with an integration time of 10 000 hr and a signal-to-noise ratio of SNR = 10. Notably, within the same observational strategy, this instrument can also detect emission at z ≲ 90 for the scenario with B0 = 0.5 nG and nB = 4.0.
All Figures
|
Fig. 1. Time evolution of PMFs’ cut-off scale caused by decaying magnetic turbulence and ambipolar diffusion ( |
| In the text | |
|
Fig. 2. Heating functions caused by decaying magnetic turbulence (solid lines) and ambipolar diffusion (dashed lines) in PMFs models with different B0 (left) and nB (right). The inset panel shows |
| In the text | |
|
Fig. 3. Dependence of ionised hydrogen fraction on redshift in models with primordial stochastic magnetic fields with different values of B0, which increases for lines from bottom to top. The dashed line is the 2σ upper limit from the CMB radiation polarization data (Planck Collaboration VI 2020). |
| In the text | |
|
Fig. 4. Evolution of baryonic matter temperature Tb (solid lines) and spin temperature Ts (dotted lines) from cosmological recombination up to z = 10 in ΛCDM model with PMF with different B0 (left panel) and with different values of spectral indices nB (right panel). The dashed line in both panels shows the temperature of CMB. The inset in the right panel shows Tb(z, B0, nB)/Tb(z, B0, nB = −2.9) for the purpose of distinguishing lines in the 21 cm line formation region. |
| In the text | |
|
Fig. 5. Dependencies of collisional coupling xc on redshift in the models ΛCDM+PMF with different values of B0 and nB. |
| In the text | |
|
Fig. 6. Global signal in hydrogen 21 cm line for PMF models with nB = −2.9 (left panel) and nB = 4 (right panel), with different values of B0 (coloured lines). |
| In the text | |
|
Fig. 7. Global signal in hydrogen 21 cm line for PMF models with B0 = 0.1 nG (left panel) and B0 = 0.5 nG (right panel), with different values of nB (coloured lines). |
| In the text | |
|
Fig. 8. Dependence of amplitude of 21 cm line |
| In the text | |
|
Fig. 9. Profiles of 21 cm lines in different (B0, nB) models of PMFs in the space R20/30 − R40/30. |
| In the text | |
Current usage metrics show cumulative count of Article Views (full-text article views including HTML views, PDF and ePub downloads, according to the available data) and Abstracts Views on Vision4Press platform.
Data correspond to usage on the plateform after 2015. The current usage metrics is available 48-96 hours after online publication and is updated daily on week days.
Initial download of the metrics may take a while.