| Issue |
A&A
Volume 706, February 2026
|
|
|---|---|---|
| Article Number | A251 | |
| Number of page(s) | 13 | |
| Section | Catalogs and data | |
| DOI | https://doi.org/10.1051/0004-6361/202557081 | |
| Published online | 17 February 2026 | |
Gaia-VVVX search for M-type variable stars in young nearby open clusters
1
Instituto de Astrofísica, Depto. de. Física y Astronomía, Facultad de Ciencias Exactas, Universidad Andrés Bello,
Av. Fernández Concha 700, Las Condes,
Santiago,
Chile
2
Vatican Observatory,
V00120
Vatican City State,
Italy
3
Centro de Astronomía (CITEVA), Universidad de Antofagasta,
Av. Angamos 601,
Antofagasta,
Chile
4
Millennium Institute of Astrophysics (MAS),
Nuncio Monseñor Sotero Sanz 100, Of. 104, Providencia,
Santiago,
Chile
5
Instituto de Astronomía, Universidad Católica del Norte,
Av. Angamos 0610,
Antofagasta,
Chile
6
Departamento de Física, Universidade Federal de Santa Catarina, Trindade
88040-900,
Florianópolis,
Brazil
7
Instituto de Física y Astronomía, Universidad de Valparaíso,
ave. Gran Bretaña, 1111, Casilla 5030,
Valparaíso,
Chile
8
Departamento de Física de la Tierra y Astrofísica & IPARCOSUCM (Instituto de Física de Partículas y del Cosmos de la UCM), Facultad de Ciencias Físicas, Universidad Complutense de Madrid,
28040
Madrid,
Spain
9
Centro de Astrobiología (CAB), CSIC-INTA, Camino Bajo del Castillo s/n,
28692
Villanueva de la Cañada, Madrid,
Spain
10
European Southern Observatory,
Karl Schwarzschildstr 2,
85748
Garching bei München,
Germany
11
Centre for Astrophysics Research, University of Hertfordshire,
College Lane,
Hatfield
AL1 09A,
UK
12
Mount Saint Vincent University,
Halifax
B3M 2J6,
Canada
13
Centre for Basic Space Science, University of Nigeria,
410101
Nsukka,
Nigeria
14
Observatorio Astronómico de Córdoba, Universidad Nacional de Córdoba,
Laprida 854,
X5000BGR,
Córdoba,
Argentina
15
Institute of Astronomy, University of Cambridge,
Madingley Rd.,
Cambridge
CB3 0HA,
UK
16
Department of Physics and Astronomy, University College London,
London
WC1E 6BT,
UK
17
NSF NOIRLab/Vera C. Rubin Observatory,
Casilla 603,
La Serena,
Chile
★★ Corresponding author: This email address is being protected from spambots. You need JavaScript enabled to view it.
Received:
2
September
2025
Accepted:
19
November
2025
Abstract
Context. While large samples of nearby M dwarfs are becoming available, it is usually difficult to estimate some intrinsic physical parameters for isolated field M dwarfs, especially their ages, radii, and masses. These parameters can be estimated through a comparison with model stellar isochrones and/or by studying eclipsing binary systems.
Aims. Our goal is to gather and analyze a large sample of variable M dwarfs that are members of nearby young open clusters and have known reddenings, distances, ages, and metallicities. This distilled sample would be useful for the comparison with theoretical models and also for the identification of eclipsing binaries with substellar companions (brown dwarfs or giant planets) for future follow-up.
Methods. We selected two dozen benchmark young and nearby open clusters (mostly with 40 < age < 132 Myr and 400 < D < 700 pc, respectively). We then combined the optical data from Gaia Data Release 3 (DR3) with near-IR JHKs−band photometry from the VISTA Variables in the Vía Láctea eXtended survey (VVVX) for these target clusters using the proper motions in order to select members within the cluster radii. Gaia and VVVX both provide a wide areal coverage that is ideally suited for mapping these nearby clusters, which are extended on the sky. We then produced optical and near-IR color–magnitude and color-color diagrams and applied appropriate color cuts to choose the M-type dwarfs at the end of the main sequence. The reddening and extinction for all clusters were estimated using the J − Ks color distributions of the cluster M dwarfs. We also compared them with the PARSEC theoretical isochrones adjusted to the respective cluster metallicities, ages, extinctions, and distances.
Results. Finally, we selected variable M stars according to Gaia DR3 (using phot_variable_flag=VARIABLE) and present a catalog of 318 variable M-dwarf star members of two dozen young nearby Galactic open clusters. The cross-validation with the Gaia DR3 parallaxes supports the cluster membership for all these sources. We also present a few examples to validate the sample of variable cluster M dwarfs.
Conclusions. This well-characterized catalog of M-dwarf members of benchmark open clusters not only constitutes a prime sample to search for transiting substellar companions, but also offers a training dataset for machine-learning applications aimed at selecting future similar targets.
Key words: stars: low-mass / stars: variables: general / open clusters and associations: individual: NGC6405 / open clusters and associations: individual: Trumpler10 / open clusters and associations: individual: NGC2422 / infrared: stars
Based on data from the ESO public survey program IDs 179.B-2002 and 198.B-2004 taken with the VISTA telescope.
© The Authors 2026
 Open Access article, published by EDP Sciences, under the terms of the Creative Commons Attribution License (https://creativecommons.org/licenses/by/4.0), which permits unrestricted use, distribution, and reproduction in any medium, provided the original work is properly cited.
This article is published in open access under the Subscribe to Open model. This email address is being protected from spambots. You need JavaScript enabled to view it. to support open access publication.
1 Introduction
M dwarfs are the most numerous stars in our Galaxy. They represent almost 75% of all stars in the Milky Way (Henry et al. 2006), although they are also the faintest stars on the main sequence because their radii are small and their surface temperatures are low. While the photometric surveys can readily select M-dwarf candidates and give temperatures, and astrometric surveys yield the distances (e.g., as in Cruz et al. 2023), it is usually very difficult to estimate some other intrinsic physical parameters for isolated field M dwarfs, especially their ages, radii, and masses. These parameters can be obtained by a comparison with theoretical models for different metallicities, and with follow-up spectroscopy of single and binary stars (Skinner et al. 2018), but large samples of suitable coeval M dwarfs to guide the models are still lacking (e.g.,Wanderley et al. 2025).
Star clusters are very useful because their member stars share similar compositions, distances, and ages. The advantageous nature of the near-IR color–magnitude diagrams (CMDs) for M-type dwarfs in star clusters was recognized by Sarajedini et al. (2009, see also Majaess et al. 2011), who reported that the lower main sequence (between 0.1 < M < 0.6 M⊙) is essentially vertical because the J − Ks color becomes insensitive to the effective temperature at these wavelengths. Variable M-dwarf stars, and in particular, eclipsing binaries that are cluster members, provide us with a golden opportunity to potentially measure their masses. These objects are difficult to select, however, because they are very faint. Nevertheless, the Gaia Data Release 3 (DR3) optical database in combination with the VISTA Variables in the Vía Láctea eXtended survey (VVVX) near-IR database represents a new opportunity to do this.
Our basic goal is to select a clean sample of variable M-dwarf star candidates that are members of nearby young open clusters. This will allow us to create a list of benchmark clusters, to provide a distilled sample for comparison with theoretical models, and to identify targets for spectroscopic follow-up that extends previous samples (e.g., Terrien et al. 2015; Donor et al. 2020; Myers et al. 2022; López-Valdivia et al. 2024). This sample is useful for several purposes. First, it helps us to identify binaries with substellar companions (brown dwarfs or giant planets) for future follow-up and to identify M dwarfs that are X-ray emitters. This allows us to study the mass dependence of the rotation-activity relation (e.g., Magaudda et al. 2022). Additionally, it enables us to extend the list of open clusters that are suitable as calibrators for gyrochronology, which is the relation of rotation rates and ages for young stars (e.g., Angus et al. 2019; Messina et al. 2022; Kounkel et al. 2022; Engle & Guinan 2023); and seismic parameters in general (Pamos Ortega et al. 2023). We can also explore the inflated radii associated with magnetic activity in young M dwarfs (e.g., Jackson et al. (2018, 2019), Wanderley et al. (2024)) and compare our findings with theoretical evolutionary models. Finally, this sample will help us to improve the design of future surveys beyond the Kepler mission and the Transiting Exoplanet Survey Satellite (TESS) mission for the Vera C. Rubin Observatory Legacy Survey of Space and Time (LSST) (LSST Science Collaboration 2009), Ivezić et al. (2019) and the Nancy Grace Roman Space Telescope (Paladini et al. 2023). It also establishes suitable selection criteria for guiding deeper and more comprehensive future studies with the Roman Space Telescope.
We first chose nearby young open clusters within the footprint of the VVVX survey, which provides deep near-IR photometry. M dwarfs are well within reach of our photometry for clusters closer than about 1 kpc. Decades of searches for Galactic star clusters can now be used fruitfully, and a number of new clusters were recently identified in the solar neighborhood and beyond. The sample of clusters with well-determined distances and ages is still limited, however (Barbá et al. 2015; Kharchenko et al. 2016; Borissova et al. 2014; Borissova et al. 2018; Borissova et al. 2020; Cantat-Gaudin et al. 2019; Cantat-Gaudin et al. 2020; Viscasillas Vázquez et al. 2024). For this first study, we therefore chose two dozen young open clusters (including a few recently discovered clusters) with known parameters. We present these parameters in Sect. 2. The optical and near-IR data and the selection of cluster members are discussed in Sect. 3. In Sect. 4 we select the candidate cluster M-dwarf stars that are variable according to Gaia DR3 and discuss some variability examples. Finally, Sect. 5 presents the conclusions and future work.
2 Cluster selection
We decided to study young nearby open clusters within the VVVX areal footprint, which provides near-IR photometry in the JHKs passbands that cover the southern Galactic plane and bulge (Minniti 2018; Minniti et al. 2010; Saito et al. 2024). The availability of Gaia DR3 data was an essential additional criterion. It provides proper motions (PMs), parallaxes, and optical photometry. Initially, we aimed to use the (Bica et al. 2019) compilation of Milky Way star clusters to select a dozen benchmark young (mostly with 40 < age < 132 yr) and nearby (d < 700 pc) open clusters with well-determined parameters from the recent literature.
Motivated mostly by the discovery of new clusters reported by different optical and IR surveys (Cantat-Gaudin et al. 2019; Hunt & Reffert 2023; He et al. 2023; Qin et al. 2023;, Gupta et al. 2024; Obasi et al. in prep.), and also by the success of our initial exploration, we then decided to add more clusters from the recent literature. The addition of these recent surveys doubled the original sample. Furthermore, in order to avoid highly active stars, we chose to exclude clusters from the sample that are younger than about 15 Myr. We also included a few more distant and/or older clusters for comparison, however: NGC3532 with an age of t = 400 Myr, Ruprecht98 with an age of t = 500 Myr, and NGC2437 with a distance of D = 1500 pc. These clusters extend our initial selection, served to confirm the wider applicability of this work, and can also guide future explorations.
The final sample of nearby young open clusters is listed in Table 1. One cluster was discarded from our sample (NGC 3228; not listed in Table 1) because it did not contain any variable M-type star candidate. Table 1 includes the cluster IDs, the positions in Galactic coordinates, the PMs in RA and Dec in mas yr−1, the distances in parsecs, the mean parallaxes measured from Gaia DR3 in mas, the ages in Myr, and the apparent cluster sizes in arcmin. Gaia and VVVX are both well suited for this research because a wide areal coverage is required as nearby clusters are distributed over a wide area of the sky, up to a few degrees. The cluster sizes in Table 1 were obtained from the literature sources listed in the table, as compiled through SIMBAD/CDS1. For [KPR2005] 49 and the OCSN clusters, we list our own search sizes. Figure 1 shows the ages (in Myr) and distances (in parsecs) covered by the sample clusters. Most clusters are young (30 < t < 300 Myr) and nearby (400 < D < 700 pc), and their metallicity is nearly solar (−0.1 < [Fe/H] < 0.2).
Figure 2 shows the position map for the sample clusters in Galactic coordinates. The different clusters are color-coded according to their distances in parsecs using the color scale shown on the right. The sample clusters are well distributed across the Southern Galactic plane. Therefore, their projected background densities along the line of sight differ from cluster to cluster. The most strongly contaminated clusters are located toward the region of the Galactic bulge, where field stars vastly out-number cluster members. Nonetheless, the exquisite Gaia DR3 astrometry allowed us to select cluster members reliably. In the following sections, we describe the process of member selection using PMs and parallax cuts, and we explore the photometric properties of the clusters through color–color diagrams (CCDs) and color–magnitude diagrams (CMDs).
Young nearby open clusters.
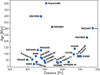 |
Fig. 1 Ages (in Myr) vs. distances (in pc) for the sample clusters. While most clusters are young (within 30 < t < 300 Myr) and nearby (within 400 < D < 700 pc), we have added a couple of other clusters in order to explore the future applicability to more distant and/or older clusters. Our sample includes also NGC3532 with age t = 400 Myr, Ruprecht98 with age t = 500 Myr, and NGC2437 with distance d = 1521 pc. |
3 The Gaia and VVVX data
We used the optical data from Gaia DR3 (Gaia Collaboration; Brown et al. 2021), in combination with the latest VVVX near-IR data (Saito et al. 2024). Gaia provides accurate positions, parallaxes, PMs, and optical photometry. The latter consists of magnitudes in the G, BP, and RP bands down to G = 21.0 mag and different flags, including a flag for confirmed variable sources (phot_variable_flag=VARIABLE) from Eyer et al. (2023) that we adopted to select the variable stars. Unfortunately, no light curves are available, but they will be released with DR4 in some years. The near-IR photometry for the VVVX survey images was obtained with DoPHOT in the JHKs passbands and reaches Ks = 18.0 mag (Terrien et al. 2015). This limit is very important because it means that the bottom of the main sequence for nearby young clusters can be reached.
After downloading the Gaia DR3 and VVVX data within the radius for each cluster, we combined the Gaia DR3 optical photometry with the VVVX near-IR photometry using a 0.7″ match radius. We started with a generous matching radius in order to account for possible large or streaming PMs, but the Gaia and VVVX positions were so good that all source separations were closer than 0.2″. Based on the full set of optical and near-IR data, we proceeded to select the members for the clusters listed in Table 1. We then created vector PM diagrams for each cluster (in equatorial coordinates) and selected members within typically 1 mas yr−1 from the cluster mean PM. This PM selection was critical because foreground and background stars largely out-number the cluster members by typically >3 orders of magnitude at these low Galactic latitudes. A specific example for the cluster Trumpler10 is shown in the top left panel of Figure 3, and the remaining PM diagrams are included in the appendix (the top left panels in Figure A.1). We did not use the parallaxes for this member selection in order to be inclusive. The parallaxes of the variable M dwarfs in the final list are consistent, however. This criterion was therefore not essential for the member selection, but helped us to perform a sanity check on the final sample. We do not claim to perform a complete census of all the variable M dwarfs in all the clusters. This is not possible because of the different types of clusters, variables, and background populations. We therefore prioritized quality over completeness.
We then created the optical and near-IR CCDs and CMDs in order to check the goodness of the PM member selection. These diagrams are shown for all clusters in Figure A.1 of Appendix A. These CMDs and CCDs were already corrected for reddening and extinction. As expected, the M-type dwarfs are located at the end of the main sequence using the optical and near-IR colors (mainly Ks versus J − Ks CMD and BP − RP versus J − Ks CCD). An additional color cut was only necessary (J − Ks < 1.0 mag) for some strongly contaminated clusters toward the bulge region to eliminate red background sources. Because so very many distant faint and red stars are located in these directions, the background contamination is significantly higher than in other directions.
The CMDs and CCDs of Figure 3 were then also compared with the appropriate PARSEC theoretical isochrones (Marigo et al. 2017) by applying the respective extinctions and distances from the recent literature. It is important to note that we did not fit the isochrones, but directly used the literature values, which were excellent fits in general. We were able to identify a few discrepancies, such as the cluster IC2395, however, for which we present updated parameters in Table 1. We also point out that it is difficult to fit the isochrones to the J − H versus H − Ks diagram, where we found a systematic difference in the J − H vs H − Ks CCDs of these young open clusters. This difference is small, but significant (i.e., beyond the photometric errors), and we were unable to determine suitable fits for the PARSEC isochrones for this near-IR CCD.
Figure 4 shows the cluster positions projected onto the plane of the Galaxy, compared with the extinction map distribution from Zucker et al. (2025). This map shows that because these are nearby clusters, the extinctions and reddenings are low in general. The only exceptions are NGC6405, NGC6281, OCSN95, and OSCN151, which appear to be located behind moderately thick dust clouds.
The M-dwarf stars are very faint in the optical, and their SEDs peak in the IR. Figure 5 shows the observed near-IR J − Ks color distribution for all PM-selected members of the sample cluster Trumpler10, including variable and nonvariable stars. Because the isochrones become vertical in the near-IR CMDs, the color concentration at about J − Ks = 0.8 mag is due to the M-type stars. The peak of the color distribution for M dwarfs is useful for determining the mean reddening, and the scatter reflects the presence or absence of differential reddening. We therefore created J − Ks color histograms to estimate the reddening and extinction homogeneously for all clusters. To do this, we applied the appropriate reddening coefficients from Zucker et al. (2025). The resulting reddening corrections were small [E(J − Ks) < 0.2 mag], and as a consequence, the choice of extinction coefficients is not critical for this work. We also made an external independent comparison between the reddening measured here using the near-IR J − Ks color and the reddening listed in the catalog of Kharchenko et al. (2016). They listed the E(B − V) values for 20 of the target clusters (the others were not yet discovered). The agreement is excellent in general, except for cluster Collinder 299, for which they listed E(B − V) = 0.333 mag, but we found a lower extinction (AK = 0.04 mag, equivalent to AV = 0.36 mag, E(B − V) = 0.12 mag). The difference probably explains the larger distance they obtained (D = 1441 pc), compared with the shorter distance adopted here (D = 687 pc).
In summary, to identify possible M-dwarf stars in open clusters, we used data from Gaia DR3 and the VVVX survey. These datasets offer photometric information in the optical and near-IR bands, which helped us to build a broader view of the stellar populations in each region. We first applied a PM selection to isolate likely cluster members. Because stars in the same cluster tend to move together through space, we used their PMs in right ascension and declination to find stars with similar values. For each cluster, we examined the PM distributions and selected stars within 1 mas yr−1 around the mean cluster concentration. This allowed us to remove many unrelated field stars and to retain only those whose motions were consistent with the cluster. After selecting members based on the PMs, we built the CMDs and CCDs. For the CMDs, we needed absolute magnitudes, which were calculated using the Gaia parallaxes. We also compared our data with theoretical isochrones to confirm that the stars fell along the expected main sequence for the cluster.
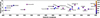 |
Fig. 2 Cluster positions projected using Galactic coordinates. The clusters are color-coded according to their distances in parsecs using the color scale shown on the right, and their IDs are labeled. Note that IC4725 is located outside of this map to the left, on the other side of the Galactic bulge. The sample clusters are distributed across the Southern Galactic plane, covering a wide range in longitudes. This means that they are different projected background densities along the line of sight, and are subject to different contamination, with the most complicated clusters located in the bulge, to the left of this map. |
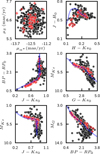 |
Fig. 3 Properties of the variable stars (red crosses) compared with the whole PM-selected cluster members (black circles) from Trumpler10 and with the appropriate PARSEC isochrones (blue sequences) of 55 Myr. Top panels: PM distributions in the RA–Dec plane (left), near-IR CCD (middle), and optical near-IR CCD (right). Bottom panels: Optical near-IR CMD (left), near-IR CMD from VVVX (middle), and optical CMD from Gaia DR3 (right). The sequences of variable stars closely follow those of the cluster members in all the diagrams, with a slight tendency to have brighter magnitudes along the main-sequence. |
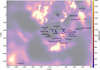 |
Fig. 4 Cluster positions projected onto the Galactic plane. The extinction map from Zucker et al. (2025) is overplotted. Interstellar clouds are shown in yellow, and clear regions are shown in black. The cluster IDs are labeled and color-coded according to their distances using the scale shown on the right. The Sun is marked with a dotted circle, and the clusters, Galactic center, and bulge are located right of this diagram. All the distances are in parsecs. Most clusters have clear lines of sight, largely free from extinction. The exceptions are NGC6405, NGC6281, OCSN95 and OSCN151, that lie behind moderately optically thick dust clouds. |
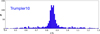 |
Fig. 5 Observed near-IR J − Ks color distributions for Trumpler10. This distribution includes variable and nonvariable stars. The color concentrations are due to the M-type stars, because the isochrones turn vertical in the near-IR CMDs. These peaks of the distributions for M dwarfs are useful to determine the mean reddenings, and the scatter reflects the presence or absence of differential reddening. |
4 Selection of the variable M-type dwarfs in nearby young OCs
We photometrically classified Ntot = 318 M-type stars that are candidate variables members of nearby young open clusters. The Gaia variability classification (specifically, phot_variable_flag=VARIABLE from Eyer et al. (2023) was the only criterion we applied to select this large and statistically significant sample of variables. Figure 6 shows the observed optical and near-IR CMDs and CCDs from Gaia DR3 and VVVX for the selected sample of variable M-dwarf members of the nearby young OCs listed in Table 1. This is a rather heterogeneous sample because it covers a wide range of the optical and near-IR parameter space. This will help guiding future studies.
The Gaia DR3 lists physical parameters (temperatures, gravities, and metallicities) for the individual sources (Gaia Collaboration 2021). These parameters confirm the selection of the targets as low-mass dwarfs with low temperatures and high gravities. The bimodal distribution in the stellar temperature Teff measured by Gaia DR3 for the young open cluster M dwarfs is very clear, however, with peaks at Teff = 4300 K and Teff = 3500 K. For example, field stars with Teff < 4000 K and log g > 4 have been classified as bona fide M dwarfs using a similar selection (Cruz et al. 2023). Therefore, we decided to determine the effective temperatures independently using the virtual observatory SED analyzer (VOSA; Bayo et al. 2008) in order to build and model spectral energy distributions of our objects, taking advantage of the optical and near-IR photometry. Following (Cruz et al. 2023), we fit the photometric spectral distributions with the BT-Settl CIFIST models (Husser et al. 2013; Baraffe et al. 2015) with solar metallicity.
We obtained stellar parameters from good VOSA model fits for all 318 sample members, with temperatures ranging from 2700 K to 4500 K. The left panel of Figure 7 shows the temperature distribution from Gaia and VOSA in red and gray, respectively. The VOSA temperatures clearly show less scatter and are cooler in the mean than those from Gaia. Within the errors, these VOSA temperatures are consistent with the classification of our sample of M dwarfs. The systematic difference between Gaia and VOSA temperatures appears to be problematic, however. The left panel of Figure 7 shows the comparison of the individual temperatures from Gaia and VOSA. It confirms that the Gaia temperatures are 249 K hotter than the VOSA temperatures in the mean. The likely explanation is that the Gaia reddenings, based on the nearby field stars, are overestimated for the sources that are members of nearby open clusters and are therefore less reddened. This systematic mean difference of 249 K is significant. It illustrates the usefulness of the VVVX near-IR photometry and the perils of using optical photometry alone to estimate temperatures for M dwarfs. We therefore caution that the parameters estimated from the Gaia optical photometry might not always be accurate for faint low-mass objects.
In order to test these temperature measurements further, we also made an external comparison with the Sloan Digital Sky Survey IV (SDSS-IV; Blanton et al. 2017) high-dispersion spectra from the Apache Point Observatory Galactic Evolution Experiment (APOGEE-2; Majewski et al. 2017), and also with the Sloan Digital Sky Survey V (SDSS-V; Kollmeier et al. 2025) Stellar LAbel Machine (SLAM), which presented the stellar parameters of M dwarfs with low-resolution optical spectra using the BOSS spectrograph (Qiu et al. 2025). Because our targets are too faint, no APOGEE-2 spectra were observed, unfortunately, but we found 6 stars out of 318 in common with the sample of M dwarfs from SLAM+BOSS:
Gaia DR3 ID 5254099330813260160 in Alessi 5 (RV = 17.3 km/s, Teff = 3361 K, log g = 4.79, [Fe/H] = −0.06),
Gaia DR3 ID 5329123441538705920 in IC 2395 (RV = 27.7 km/s, Teff = 3940 K, log g = 4.71, [Fe/H] = −0.06),
Gaia DR3 ID 5329105776319635072 in IC 2395 (RV = 26.9 km/s, Teff = 3466 K, log g = 4.80, [Fe/H] = 0.23),
Gaia DR3 ID 5329149658020365184 in IC 2395(RV = 22.0 km/s, Teff = 3873 K, log g = 4.71, [Fe/H] = 0.13),
Gaia DR3 ID 5329203808965896192 in IC 2395 (RV = 22.6 km/s, Teff = 3969 K, log g = 4.72, [Fe/H] = −0.06), and
Gaia DR3 ID 5338656860222332800 in NGC 3532 (RV = 11.8 km/s, Teff = 3964 K, log g = 4.71, [Fe/H] = −0.06).
This comparison reveals that the stars are cooler and more metal rich in general than the values measured by Gaia. This confirms our classification of them as M dwarfs. We therefore decided to keep all the stars in our sample, including those that might be K dwarfs according to the Gaia estimated temperatures.
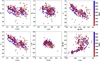 |
Fig. 6 Observed optical and near-IR CMDs and CCDs from Gaia DR3 and VVVX for the selected sample of variable M-dwarf members of nearby young OCs. The individual stars are color-coded by distance. |
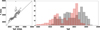 |
Fig. 7 Left panel. Comparison of the individual temperatures from Gaia and VOSA, showing that the Gaia temperatures are significantly hotter than the VOSA temperatures in the mean. Right panel. Effective temperature distribution from Gaia and VOSA shown in red and gray, respectively, illustrating that the VOSA temperatures have less scatter and are cooler in the mean than the ones from Gaia. |
4.1 Variability of the M-dwarf sample
M-dwarf stars exhibit three types of behaviors in their variability in general: They can have high- or low-amplitude flares (e.g., Hilton et al. 2010; Balona 2015; Jackman et al. 2021; Kumar et al. 2023; Voloshina et al. 2024), they can have low-amplitude rotational modulations due to spots (e.g., Somers et al. 2017; Lanzafame et al. 2018), or they can be eclipsing binaries (including low-amplitude planetary transits). The first two types are usually related because the stellar activity of young M dwarfs can be related to magnetic fields, coronal ejections, and spots. We are mostly interested in identifying eclipsing binaries, which might be followed-up photometrically to obtain radii, periods, and amplitudes, and followed-up spectroscopically to obtain orbital parameters that might yield accurate masses. In general, nearly equal-mass binaries lie on a sequence that is located above the main sequence and is brighter by up to 0.7 mag. This allowed us to select likely eclipsing binaries among all the variable stars. Eclipsing binaries with magnitudes that remain on the main sequence would be more interesting because this might indicate a high mass ratio, as expected for eclipses caused by substellar companions, such as brown dwarfs or giant planets.
As an external comparison, we searched for the matches that are included in the Gaia DR3 catalog of eclipsing binaries of Mowlavi et al. (2023). Four stars have previously published orbital solutions in common with that catalog:
Gaia DR3 ID 3029149659736330496 in the open cluster NGC2437, with P = 0.593835 d, Amp1 = 0.162 mag, Amp2 = 0.118 mag, G = 19.092 mag, BP − RP = 1.625 mag, J = 16.617 ± 0.021 mag, H = 15.939 ± 0.022 mag, Ks = 15.716 ± 0.041 mag;
Gaia DR3 ID 3029201298131373440 in the open cluster NGC2437, with P = 1.389468 d, Amp1 = 0.195 mag, Amp2 = 0.166 mag, G = 19.363 mag, BP − RP = 2.000 mag, J = 16.959 ± 0.009 mag, H = 16.279 ± 0.016 mag, Ks = 16.054 ± 0.045 mag;
Gaia DR3 ID 5355632357656878464 in the open cluster ASCC58, with P = 0.247796 d, G = 15.124 mag, Amp1 = 0.451 mag, Amp2 = 0.053 mag, G = 15.131 mag, BP − RP = 1.655 mag, J = 13.110 ± 0.004 mag, H = 12.485 ± 0.008 mag, Ks = 12.313 ± 0.014 mag.
Gaia DR3 ID 5889342448592492928 in the open cluster Alessi 8, with P = 0.328053 d, Amp1 = 0.424 mag, Amp2 = 0.385 mag, G = 20.010 mag, BP − RP = 1.888 mag, J = 17.356 ± 0.033 mag, H = 16.773 ± 0.070 mag, Ks = 16.512 ± 0.086 mag.
The observed secondary amplitudes for the last two stars would imply low-mass companions with M ~ 0.15–0.20 M⊙ (assuming that they are not grazing eclipses). These four binaries in common with the catalog of Mowlavi et al. (2023) serve as an independent confirmation of the robust nature of our selection and validate the results. They are also prime candidates for refining the orbital solutions, in order to constrain the masses of the binary components.
Cruz et al. (2023) analyzed the near-IR light curves for a sample of nearby (D < 500 pc) field M dwarfs located in the direction of the central Galactic bulge (VVVX tile b294) and obtained reliable periods for 82 objects within 0.14 < P (days) <34. Of these, 27 are thought to be good binary-system candidates. In an effort to also explore the current VVVX data for the variable open cluster M dwarfs, we present in Figure 8 some examples of variable M-dwarf star members of the open cluster NGC6405: a likely flare star (top panel), and a likely low-mass eclipsing binary (bottom panel). These PSF photometric measurements were taken from the VIRAC2 project (Smith et al. 2018; Smith et al. 2025), including the latest VVVX observation epochs.
The first example shows the light curve comprising N=349 observations of star Gaia DR3 ID 4054211053152294016, located at RA = 264.94271054 deg, Dec = −32.40465797 deg, with a mean Ks = 13.602 ± 0.069 mag and J − Ks = 0.957 ± 0.07 mag. The baseline of this light curve is mostly flat, with sudden brightness increases with an amplitude of 0.1–0.5 mag in nonperiodic fashion. The observed Ks−band distribution is skewed to brighter magnitudes. The second example shows the light curve with N=400 observations of star Gaia DR3 ID 4054313509551765120, located at RA = 265.33106750 deg and Dec = −32.17876225 deg, with a mean Ks = 14.359 ± 0.048 mag and J − Ks = 0.893 ± 0.05 mag. The baseline of this light curve is mostly flat, with small decreases in brightness, as expected for an eclipsing object. The observed Ks−band distribution is skewed to fainter magnitudes, as expected for an eclipsing object. We were unable to secure a period for this light curve, but we note that the amplitude is small, AK = 0.15 mag. If this is an eclipsing object with full transits (i.e., not a grazing binary), the size of the secondary is therefore much smaller than that of the parent star, which has MK = 6.1 mag and MG = 9.5 mag (equivalent to Ms = 0.43 M⊙ and Rs = 0.43 R⊙ using the calibrations of Mann et al. 2019 and Cifuentes et al. 2025) and is valid for field M dwarfs. Similarly, using the PARSEC isochrones, these are equivalent to Ms = 0.45 M⊙ and Rs = 0.45 R⊙.
We conclude that this is very promising because the variability suggested by the Gaia DR3 phot_variable_flag=VARIABLE from Eyer et al. (2023) is indeed confirmed by the VVVX light curves for these two objects. In addition to the visual inspection of the VVVX light curves, we used a Stetson index algorithm to quantify the variability. Both objects showed significant values of 0.539166 and 0.693172 for Gaia DR3 ID 4054211053152294016 and Gaia DR3 4054313509551765120, respectively. The Stetson indices (Stetson 1996) for all other selected variables range from 0.467 to 0.782. This certainly motivates a detailed examination of our selected variable M dwarfs in open clusters using the VVVX data following Cruz et al. (2023), and complementing this examination with the Gaia DR4 light curves when they become available.
We also assessed the spread of the full sample using the computed absolute magnitudes in G and Ks bands in comparison with the M-dwarf calibrations of Mann et al. (2019) and Cifuentes et al. (2025). The M dwarfs of our final sample are expected to cover a range in radii of 0.25 < R/R⊙ < 0.65 and a range in masses within 0.25 < M/M⊙ < 0.65. In particular, the smallest M-type stars detected here reach R ~ 0.25 R⊙. These objects lie just above the hydrogen-burning limit and represent the lower end of the stellar main sequence in radius and mass. The comparison with the PARSEC isochrones that give theoretical masses and radii yielded similar results. We identified half a dozen such stars in the sample, including star Gaia DR3 ID 5329089627248989312 in OCSN175, Gaia DR3 ID 5524109454905471104 and Gaia DR3 ID 5524227755487457664 in Trumpler10, and Gaia DR3 ID 5340165012172974848 in NGC3532.
These are interesting because they are small stars, and the depth expected for the eclipses caused by brown dwarfs or giant planets would therefore be significant and make them more easily detectable in the optical light curves from Gaia or in the near-IR light curves from the VVVX survey. For these stellar sizes, the depths of exoplanet transits from a Jupiter-sized planet would indeed be detectable.
Therefore, we surmise that this is a prime sample for a search for giant planets around low-mass stars in nearby young OCs. In principle, the Gaia and VVVX photometry are both good enough to detect planets as small as Uranus or Neptune that transit these stars, while super-Earth and smaller-size planets would remain beyond reach. Thus, our future work includes the analysis of these light curves when they become available in order to select the most promising candidates that are suitable for a spectroscopic follow-up. The spectroscopy would be useful first and foremost to confirm the stellar spectral type, and then, if accurate radial velocities are measurable, to estimate the companion masses (Skinner et al. 2018). For example, our recently approved large spectroscopic public survey with the Very large Telescope (VLT) at the European Southern Observatory (ESO) entitled “VVVXS-GalCen Survey” can observe stars down to Ks ~ 12.5 mag, and some dozen targets are located above this limit in our sample.
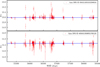 |
Fig. 8 Observed VVVX Ks−band light curves for two candidate variable M-type stars in the young open cluster NGC6405. Top panel: Gaia DR3 ID 4054211053152294016 (Stetson index = 0.539), a flare star candidate located at at RA = 264.94271054 deg, Dec = −32.40465797 deg. Bottom panel: Gaia DR3 4054313509551765120 (Stetson index = 0.693), an eclipsing binary star candidate located at RA= 265.33106750 deg, Dec = −32.17876225 deg. Visual inspection of the light curves and their Stetson indices indicate that both stars are indeed variable (Stetson 1996). The solid blue line represents the median magnitude value for each case and was calculated from all points in the light curve. |
5 Conclusions and future steps
Binaries that contain two M dwarfs or an M dwarf with a lower-mass companion can give unique constraints on the lower main sequence and BD and giant planet transition. The M-dwarf binaries provide masses and radii, while the open clusters provide distances and ages from the fitting to theoretical isochrones. The VVVX near-IR coverage of extended nearby open clusters was combined with Gaia DR3 astrometry to select bona fide cluster members. With these data, we used the Gaia variability classification (specifically, phot_variable_flag=VARIABLE from Eyer et al. 2023) to search for potential M-dwarf eclipsing binary candidates. The final catalog contains 318 variable M-dwarf star members of two dozen young nearby Galactic open clusters. The cross-validation with the Gaia DR3 parallaxes supports the cluster membership for all these sources, and 6 sources are spectroscopically confirmed. This is a prime sample for spectroscopic follow-up to constrain the masses for a statistically interesting sample of M dwarfs with known ages and to identify substellar companions (BDs and planets).
Future work includes obtaining spectroscopy and light curves to measure periods, amplitudes, radii, and masses with the aim to enable a detailed comparison with theoretical models. The cluster sample can be expanded to include older and more distant systems, which is feasible with current data out to approximately 2 kpc, as suggested by our analysis of NGC2437 (D = 1500 pc). Additionally, a classification of variable stars will be pursued with a focus on the most likely scenarios, in particular, on identifying eclipsing binary candidates located above or along the cluster main sequence.
The optical light curves from Gaia, containing hundreds of epochs, are not available now because they will be released with DR4. On the other hand, the light curves of the VISTA Variables in the Via Lactea survey (VVV – Minniti et al. 2010) contain between 112 and 400 epochs, but only 25–50 epochs are available for light curves of the VVVX data. Therefore, we need complementary data and better light curves in order to search for planets in the extended VVVX area. These data would be acquired by the LSST/Rubin telescope in the near future, where Galactic plane observations are expected to yield between 160 and 900 epochs, depending on the field (Sajadian & Poleski 2019).
In consequence, this work is also a pathfinder to search for planets orbiting M-dwarf members of nearby open clusters with the LSST/Rubin telescope. This telescope will map the Galactic plane (Street et al. 2023) and provide stellar light curves in the optical passbands ugryz down to r ~ 25 mag (single epoch). This limit is a few magnitudes fainter than the Gaia DR3 optical photometry upon which our work is based now. The Gaia light curves will be released in DR4 in some years and will contain about 66 months of data, which is enough to find candidate transits in combination with our near-IR data. Importantly, because the planets are essentially dark, the planetary transits are a geometric effect, and the transits should be independent of color. This means the same depth at all wavelengths, which is an important fact for distinguishing them from the eclipsing binary stars, for example, where the eclipses exhibit a strong color dependence. Because many of these candidates will be of high quality, it will be possible to identify those that fulfill the requirement of transit depths that are similar in the optical and near-IR passbands. Our near-IR photometry is complementary to the LSST dataset in this respect, and allows the user to select M-dwarf members down to the bottom of the main sequence of nearby open clusters such as those studied here. It also supports the identification of true planetary transits while filtering out binary systems.
The catalog of candidate eclipsing M dwarfs we generated can also serve as a valuable input for machine-learning classification pipelines, variability studies, and future surveys seeking to optimize target selection in dense stellar regions. This work therefore not only contributes new targets, but is also a curated training set for upcoming time-domain missions.
Data availability
TheThe catalog is available at the CDS via https://cdsarc.cds.unistra.fr/viz-bin/cat/J/A+A/706/A251.
Acknowledgements
We gratefully acknowledge the use of data from the ESO Public Survey program IDs 179.B-2002 and 198.B-2004 taken with the VISTA telescope and data products from the Cambridge Astronomical Survey Unit. D.M. and M.L. are supported by ANID Fondecyt Regular grant No. 1220724, and by the ANID BASAL Center for Astrophysics and Associated Tecnologies (CATA) through ANID grants ACE210002 and FB210003. J.A.-G. acknowledges the support from ANID FONDECYT Regular grant No. 1201490. J.B. acknowledges the support from ANID Fondecyt Regular grant No. 1240249. J.G.F.-T. acknowledges the support provided by ANID Fondecyt Iniciación No. 11220340, ANID Fondecyt Postdoc No. 3230001, and the Joint Committee ESO-Government of Chile under the agreement 2023 ORP 062/2023. P.W.L. acknowledges support by STFC grant ST/Y000846/1. C.O.O. acknowledges the support provided by the Joint Committee ESO-Government of Chile under the agreement 2023 ORP 062/2023. M.G. acknowledges the support from ANID Fondecyt Regular grant No. 1240755. R.K.S. acknowledges support from CNPq/Brazil through projects 308298/2022-5 and 421034/2023-8 P.C. and E.S. acknowledge the support from the Spanish Virtual Observatory project funded by the Spanish Ministry of Science and Innovation/State Agency of Research MCIN/AEI/10.13039/501100011033 through grant PID2023-146210NB- I00. C.C. acknowledges support by ANID BASAL project FB210003. This work is also supported by the China-Chile Joint Research Fund (CCJRF No.2301) and the Chinese Academy of Sciences South America Center for Astronomy (CASSACA) Key Research Project E52H540301. This research has made use of the SIMBAD database, CDS, Strasbourg Astronomical Observatory, France, and of data from the European Space Agency (ESA) mission Gaia (http://www.cosmos.esa.int/gaia), processed by the Gaia Data Processing and Analysis Consortium (DPAC, http://www.cosmos.esa.int/web/gaia/dpac/consortium).
References
- Angus, R., Morton, T. D., Foreman-Mackey, D., et al. 2019, AJ, 158, 173 [Google Scholar]
- Balona, L. A. 2015, MNRAS, 447, 2714 [Google Scholar]
- Baraffe, I., Homeier, D., Allard, F., & Chabrier, G. 2015, A&A, 577, A42 [NASA ADS] [CrossRef] [EDP Sciences] [Google Scholar]
- Barbá, R. H., Roman-Lopes, A., Nilo Castellón, J. L., et al. 2015, A&A, 581, A120 [NASA ADS] [CrossRef] [EDP Sciences] [Google Scholar]
- Bayo, A., Rodrigo, C., Barrado Y Navascués, D., et al. 2008, A&A, 492, 277 [NASA ADS] [CrossRef] [EDP Sciences] [Google Scholar]
- Bica, E., Pavani, D. B., Bonatto, C. J., & Lima, E. F. 2019, AJ, 157, 12 [Google Scholar]
- Blanton, M. R., Bershady, M. A., Abolfathi, B., et al. 2017, AJ, 154, 28 [Google Scholar]
- Borissova, J., Chené, A. N., Ramírez Alegría, S., et al. 2014, A&A, 569, A24 [NASA ADS] [CrossRef] [EDP Sciences] [Google Scholar]
- Borissova, J., Ivanov, V. D., Lucas, P. W., et al. 2018, MNRAS, 481, 3902 [NASA ADS] [CrossRef] [Google Scholar]
- Borissova, J., Kurtev, R., Amarinho, N., et al. 2020, MNRAS, 499, 3522 [NASA ADS] [CrossRef] [Google Scholar]
- Bossini, D., Vallenari, A., Bragaglia, A., et al. 2019, A&A, 623, A108 [NASA ADS] [CrossRef] [EDP Sciences] [Google Scholar]
- Cantat-Gaudin, T., & Anders, F. 2020, A&A, 633, A99 [NASA ADS] [CrossRef] [EDP Sciences] [Google Scholar]
- Cantat-Gaudin, T., Krone-Martins, A., Sedaghat, N., et al. 2019, A&A, 624, A126 [NASA ADS] [CrossRef] [EDP Sciences] [Google Scholar]
- Cantat-Gaudin, T., Anders, F., Castro-Ginard, A., et al. 2020, A&A, 640, A1 [NASA ADS] [CrossRef] [EDP Sciences] [Google Scholar]
- Cifuentes, C., Caballero, J. A., González-Payo, J., et al. 2025, A&A, 693, A228 [NASA ADS] [CrossRef] [EDP Sciences] [Google Scholar]
- Cruz, P., Cortés-Contreras, M., Solano, E., et al. 2023, MNRAS, 520, 4730 [Google Scholar]
- Dias, W. S., Monteiro, H., Moitinho, A., et al. 2021, MNRAS, 504, 356 [NASA ADS] [CrossRef] [Google Scholar]
- Dib, S., Schmeja, S., & Parker, R. J. 2018, MNRAS, 473, 849 [Google Scholar]
- Donor, J., Frinchaboy, P. M., Cunha, K., et al. 2020, AJ, 159, 199 [NASA ADS] [CrossRef] [Google Scholar]
- Engle, S. G., & Guinan, E. F. 2023, ApJ, 954, L50 [NASA ADS] [CrossRef] [Google Scholar]
- Eyer, L., Audard, M., Holl, B., et al. 2023, A&A, 674, A13 [NASA ADS] [CrossRef] [EDP Sciences] [Google Scholar]
- Gaia Collaboration (van Leeuwen, F., et al.) 2017, A&A, 601, A19 [NASA ADS] [CrossRef] [EDP Sciences] [Google Scholar]
- Gaia Collaboration (Babusiaux, C., et al.) 2018, A&A, 616, A10 [NASA ADS] [CrossRef] [EDP Sciences] [Google Scholar]
- Gaia Collaboration, (Brown, A. G. A. V. A.) et al. 2021, A&A, 649, A1 [NASA ADS] [CrossRef] [EDP Sciences] [Google Scholar]
- Gupta, A., Ivanov, V. D., Preibisch, T., & Minniti, D. 2024, A&A, 692, A194 [NASA ADS] [CrossRef] [EDP Sciences] [Google Scholar]
- He, Z., Wang, K., Luo, Y., et al. 2022, ApJS, 262, 7 [NASA ADS] [CrossRef] [Google Scholar]
- He, Z., Liu, X., Luo, Y., et al. 2023, ApJS, 264, 8 [NASA ADS] [CrossRef] [Google Scholar]
- Henry, T. J., Jao, W.-C., Subasavage, J. P., et al. 2006, AJ, 132, 2360 [Google Scholar]
- Hilton, E. J., West, A. A., Hawley, S. L., & Kowalski, A. F. 2010, AJ, 140, 1402 [Google Scholar]
- Hunt, E. L., & Reffert, S. 2023, A&A, 673, A114 [NASA ADS] [CrossRef] [EDP Sciences] [Google Scholar]
- Husser, T. O., Wende-von Berg, S., Dreizler, S., & Chabrier, G. 2013, A&A, 553, A6 [NASA ADS] [CrossRef] [EDP Sciences] [Google Scholar]
- Ivezić, Ž., Kahn, S. M., Tyson, J. A., et al. 2019, ApJ, 873, 111 [Google Scholar]
- Jackman, J. A. G., Wheatley, P. J., Acton, J. S., et al. 2021, MNRAS, 504, 3246 [NASA ADS] [CrossRef] [Google Scholar]
- Jackson, R. J., Deliyannis, C. P., & Jeffries, R. D. 2018, MNRAS, 476, 3245 [NASA ADS] [CrossRef] [Google Scholar]
- Jackson, R. J., Jeffries, R. D., Deliyannis, C. P., et al. 2019, MNRAS, 483, 1125 [CrossRef] [Google Scholar]
- Kharchenko, N. V., Piskunov, A. E., Röser, S., et al. 2005, A&A, 440, 403 [NASA ADS] [CrossRef] [EDP Sciences] [Google Scholar]
- Kharchenko, N. V., Piskunov, A. E., Schilbach, E., et al. 2016, A&A, 585, A101 [NASA ADS] [CrossRef] [EDP Sciences] [Google Scholar]
- Kollmeier, J. A., Rix, H.-W., Aerts, C., et al. 2025, AJ [arXiv:2507.06989] [Google Scholar]
- Kounkel, M., Stassun, K. G., Bouma, L. G., et al. 2022, AJ, 164, 137 [NASA ADS] [CrossRef] [Google Scholar]
- Kumar, V., Rajpurohit, A. S., Srivastava, M. K., et al. 2023, MNRAS, 524, 6085 [Google Scholar]
- Lanzafame, A. C., Distefano, E., Messina, S., et al. 2018, A&A, 616, A16 [NASA ADS] [CrossRef] [EDP Sciences] [Google Scholar]
- López-Valdivia, R., Adame, L., Zagala Lagunas, E., et al. 2024, MNRAS, 533, 395 [Google Scholar]
- LSST Science Collaboration, (Abell, P. A., et al.) 2009, arXiv e-prints [arXiv:0912.0201] [Google Scholar]
- Magaudda, E., Stelzer, B., Raetz, S., et al. 2022, A&A, 661, A29 [NASA ADS] [CrossRef] [EDP Sciences] [Google Scholar]
- Majaess, D. J., Turner, D. G., Lane, D. J., et al. 2011, JAAVSO, 39, 219 [Google Scholar]
- Majewski, S. R., Schiavon, R. P., Frinchaboy, P. M., et al. 2017, AJ, 154, 94 [NASA ADS] [CrossRef] [Google Scholar]
- Mann, A. W., Dupuy, T., Kraus, A. L., et al. 2019, ApJ, 871, 63 [Google Scholar]
- Marigo, P., Girardi, L., Bressan, A., et al. 2017, ApJ, 835, 77 [Google Scholar]
- Mendigutía, I., Solano, E., Vioque, M., et al. 2022, A&A, 664, A66 [NASA ADS] [CrossRef] [EDP Sciences] [Google Scholar]
- Messina, S., Nardiello, D., Desidera, S., et al. 2022, A&A, 657, L3 [NASA ADS] [CrossRef] [EDP Sciences] [Google Scholar]
- Minniti, D., 2018, in “The Vatican Observatory, Castel Gandolfo: 80th Anniversary Celebration”, eds. G. Gionti, & J.-B. Kikwaya Eluo, (Springer International Publishing AG), ASSP, 51, 63 [Google Scholar]
- Minniti, D., Lucas, P. W., Emerson, J. P., et al. 2010, New A, 15, 433 [Google Scholar]
- Monteiro, H., & Dias, W. S. 2019, MNRAS, 487, 2385 [Google Scholar]
- Morales, E. F. E., Wyrowski, F., Schuller, F., & Menten, K. M. 2013, A&A, 560, A76 [NASA ADS] [CrossRef] [EDP Sciences] [Google Scholar]
- Mowlavi, N., Holl, B., Lecoeur-Taïbi, I., et al. 2023, A&A, 674, A16 [NASA ADS] [CrossRef] [EDP Sciences] [Google Scholar]
- Myers, N., Donor, J., Spoo, T., et al. 2022, AJ, 164, 85 [NASA ADS] [CrossRef] [Google Scholar]
- Netopil, M., Oralhan, I. A., Çakmak, H., et al. 2022, MNRAS, 509, 421 [Google Scholar]
- Paladini, R., Zucker, C., Benjamin, R., et al. 2023, arXiv e-prints [arXiv:2307.07642] [Google Scholar]
- Pamos Ortega, D., Mirouh, G. M., García Hernández, A., et al. 2023, A&A, 675, A167 [NASA ADS] [CrossRef] [EDP Sciences] [Google Scholar]
- Pang, X., Tang, S.-Y., Li, Y., et al. 2022, ApJ, 931, 156 [NASA ADS] [CrossRef] [Google Scholar]
- Poggio, E., Drimmel, R., Cantat-Gaudin, T., et al. 2021, A&A, 651, A104 [NASA ADS] [CrossRef] [EDP Sciences] [Google Scholar]
- Qin, S., Zhong, J., Tang, T., & Chen, L. 2023, ApJS, 265, 12 [NASA ADS] [CrossRef] [Google Scholar]
- Qiu, D., Johnson, J. A., Liu, C., et al. 2025, arXiv e-prints [arXiv:2511.20005] [Google Scholar]
- Saito, R. K., Hempel, M., Alonso-García, J., et al. 2024, A&A, 689, A148 [NASA ADS] [CrossRef] [EDP Sciences] [Google Scholar]
- Sajadian, S., & Poleski, R. 2019, ApJ, 871, 205 [NASA ADS] [CrossRef] [Google Scholar]
- Sarajedini, A., Dotter, A., & Kirkpatrick, A. 2009, ApJ, 698, 1872 [NASA ADS] [CrossRef] [Google Scholar]
- Skinner, J., Covey, K. R., Bender, C. F., et al. 2018, AJ, 156, 45 [NASA ADS] [CrossRef] [Google Scholar]
- Smith, L. C., Lucas, P. W., Kurtev, R., et al. 2018, MNRAS, 474, 1826 [Google Scholar]
- Smith, L. C., Lucas, P. W., Koposov, S. E., et al. 2025, MNRAS, 536, 3707 [NASA ADS] [CrossRef] [Google Scholar]
- Somers, G., Stauffer, J., Rebull, L., et al. 2017, ApJ, 850, 134 [NASA ADS] [CrossRef] [Google Scholar]
- Spina, L., Ting, Y. S., De Silva, G. M., et al. 2021, MNRAS, 503, 3279 [CrossRef] [Google Scholar]
- Stetson, P. B. 1996, PASP, 108, 851 [NASA ADS] [CrossRef] [Google Scholar]
- Street, R. A., Li, X., Khakpash, S., et al. 2023, ApJS, 267, 15 [Google Scholar]
- Strobel, A., Skaba, W., & Proga, D. 1992, A&AS, 93, 271 [Google Scholar]
- Tarricq, Y., Soubiran, C., Casamiquela, L., et al. 2022, A&A, 659, A59 [NASA ADS] [CrossRef] [EDP Sciences] [Google Scholar]
- Terrien, R. C., Mahadevan, S., Deshpande, R., & Bender, C. F. 2015, ApJS, 220, 16 [Google Scholar]
- Tsantaki, M., Delgado-Mena, E., Bossini, D., & Martins, J. H. C. 2023, A&A, 674, A157 [NASA ADS] [CrossRef] [EDP Sciences] [Google Scholar]
- Viscasillas Vázquez, C., Magrini, L., Miret-Roig, N., et al. 2024, A&A, 689, A268 [NASA ADS] [CrossRef] [EDP Sciences] [Google Scholar]
- Voloshina, A. S., Lavrukhina, A. D., Pruzhinskaya, M. V., et al. 2024, MNRAS, 533, 4309 [Google Scholar]
- Wanderley, F., Cunha, K., Kochukhov, O., et al. 2024, ApJ, 971, 112 [NASA ADS] [CrossRef] [Google Scholar]
- Wanderley, F., Cunha, K., Smith, V. V., et al. 2025, ApJ, 993, 233 [Google Scholar]
- Zucker, C., Saydjari, A. K., Speagle, J. S., et al. 2025, ApJ, 992, 39 [Google Scholar]
Appendix A PM and Diagrams
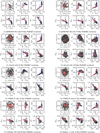 |
Fig. A.1 Properties of the variable stars (red crosses) are compared with the entire proper motion (PM) selected cluster members (black circles) from all the open clusters listed in Table 1, along with the corresponding PARSEC isochrones (blue lines). For each figure: Top panels show the PM distributions in the RA–Dec plane (left), the near-IR color–color diagram (middle), and the optical–near-IR color–color diagram (right). Bottom panels display the optical–near-IR color–magnitude diagram (CMD) (left), the near-IR CMD from VVVX survey (middle), and the optical CMD from Gaia DR3 (right). Figures (9) and (10) present the same dataset for IC 2395, but use different isochrones for comparison. Figures (16) and (17) correspond to the same cluster with data from the Gaia survey and VVV, respectively. Figures (22) and (23) compare two datasets of OSCN151, each adopting different proper motions (PM), resulting in variations in the derived data. |
All Tables
All Figures
|
Fig. 1 Ages (in Myr) vs. distances (in pc) for the sample clusters. While most clusters are young (within 30 < t < 300 Myr) and nearby (within 400 < D < 700 pc), we have added a couple of other clusters in order to explore the future applicability to more distant and/or older clusters. Our sample includes also NGC3532 with age t = 400 Myr, Ruprecht98 with age t = 500 Myr, and NGC2437 with distance d = 1521 pc. |
| In the text | |
|
Fig. 2 Cluster positions projected using Galactic coordinates. The clusters are color-coded according to their distances in parsecs using the color scale shown on the right, and their IDs are labeled. Note that IC4725 is located outside of this map to the left, on the other side of the Galactic bulge. The sample clusters are distributed across the Southern Galactic plane, covering a wide range in longitudes. This means that they are different projected background densities along the line of sight, and are subject to different contamination, with the most complicated clusters located in the bulge, to the left of this map. |
| In the text | |
|
Fig. 3 Properties of the variable stars (red crosses) compared with the whole PM-selected cluster members (black circles) from Trumpler10 and with the appropriate PARSEC isochrones (blue sequences) of 55 Myr. Top panels: PM distributions in the RA–Dec plane (left), near-IR CCD (middle), and optical near-IR CCD (right). Bottom panels: Optical near-IR CMD (left), near-IR CMD from VVVX (middle), and optical CMD from Gaia DR3 (right). The sequences of variable stars closely follow those of the cluster members in all the diagrams, with a slight tendency to have brighter magnitudes along the main-sequence. |
| In the text | |
|
Fig. 4 Cluster positions projected onto the Galactic plane. The extinction map from Zucker et al. (2025) is overplotted. Interstellar clouds are shown in yellow, and clear regions are shown in black. The cluster IDs are labeled and color-coded according to their distances using the scale shown on the right. The Sun is marked with a dotted circle, and the clusters, Galactic center, and bulge are located right of this diagram. All the distances are in parsecs. Most clusters have clear lines of sight, largely free from extinction. The exceptions are NGC6405, NGC6281, OCSN95 and OSCN151, that lie behind moderately optically thick dust clouds. |
| In the text | |
|
Fig. 5 Observed near-IR J − Ks color distributions for Trumpler10. This distribution includes variable and nonvariable stars. The color concentrations are due to the M-type stars, because the isochrones turn vertical in the near-IR CMDs. These peaks of the distributions for M dwarfs are useful to determine the mean reddenings, and the scatter reflects the presence or absence of differential reddening. |
| In the text | |
|
Fig. 6 Observed optical and near-IR CMDs and CCDs from Gaia DR3 and VVVX for the selected sample of variable M-dwarf members of nearby young OCs. The individual stars are color-coded by distance. |
| In the text | |
|
Fig. 7 Left panel. Comparison of the individual temperatures from Gaia and VOSA, showing that the Gaia temperatures are significantly hotter than the VOSA temperatures in the mean. Right panel. Effective temperature distribution from Gaia and VOSA shown in red and gray, respectively, illustrating that the VOSA temperatures have less scatter and are cooler in the mean than the ones from Gaia. |
| In the text | |
|
Fig. 8 Observed VVVX Ks−band light curves for two candidate variable M-type stars in the young open cluster NGC6405. Top panel: Gaia DR3 ID 4054211053152294016 (Stetson index = 0.539), a flare star candidate located at at RA = 264.94271054 deg, Dec = −32.40465797 deg. Bottom panel: Gaia DR3 4054313509551765120 (Stetson index = 0.693), an eclipsing binary star candidate located at RA= 265.33106750 deg, Dec = −32.17876225 deg. Visual inspection of the light curves and their Stetson indices indicate that both stars are indeed variable (Stetson 1996). The solid blue line represents the median magnitude value for each case and was calculated from all points in the light curve. |
| In the text | |
|
Fig. A.1 Properties of the variable stars (red crosses) are compared with the entire proper motion (PM) selected cluster members (black circles) from all the open clusters listed in Table 1, along with the corresponding PARSEC isochrones (blue lines). For each figure: Top panels show the PM distributions in the RA–Dec plane (left), the near-IR color–color diagram (middle), and the optical–near-IR color–color diagram (right). Bottom panels display the optical–near-IR color–magnitude diagram (CMD) (left), the near-IR CMD from VVVX survey (middle), and the optical CMD from Gaia DR3 (right). Figures (9) and (10) present the same dataset for IC 2395, but use different isochrones for comparison. Figures (16) and (17) correspond to the same cluster with data from the Gaia survey and VVV, respectively. Figures (22) and (23) compare two datasets of OSCN151, each adopting different proper motions (PM), resulting in variations in the derived data. |
| In the text | |
Current usage metrics show cumulative count of Article Views (full-text article views including HTML views, PDF and ePub downloads, according to the available data) and Abstracts Views on Vision4Press platform.
Data correspond to usage on the plateform after 2015. The current usage metrics is available 48-96 hours after online publication and is updated daily on week days.
Initial download of the metrics may take a while.