| Issue |
A&A
Volume 707, March 2026
|
|
|---|---|---|
| Article Number | A300 | |
| Number of page(s) | 10 | |
| Section | Cosmology (including clusters of galaxies) | |
| DOI | https://doi.org/10.1051/0004-6361/202558610 | |
| Published online | 13 March 2026 | |
Early growth of massive black holes in dynamical dark energy models with negative cosmological constant
1
Istituto Nazionale di Astrofisica (INAF), Osservatorio Astronomico di Roma, Via Frascati 33, 00078 Monte Porzio Catone (RM), Italy
2
Centre for Theoretical Physics, Jamia Millia Islamia, New Delhi 110025, India
3
School of Physics & Astronomy, University of Southampton, Highfield, Southampton SO17 1BJ, UK
★ Corresponding author: This email address is being protected from spambots. You need JavaScript enabled to view it.
Received:
17
December
2025
Accepted:
3
February
2026
Abstract
Context. Recent results from combined cosmological probes indicate that the dark energy component of the Universe could be dynamical. The simplest explanation envisages the presence of a quintessence field rolling into a potential, where the dark energy density parameter ΩDE = ΩΛ + Ωx results from the contribution of the ground-state energy, ΩΛ, and the scalar field energy, Ωx. Provided that ΩDE ≈ 0.7, negative values of ΩΛ can be consistent with current measurements from cosmological probes and could help explain the large abundance of bright galaxies observed by the JWST at z > 10, largely exceeding the pre-JWST expectations in a Λ cold dark matter universe.
Aims. We aim to explore the extent to which such a scenario can also account for the early presence of massive black holes (BHs) with masses of MBH ≳ 107 M⊙ observed at z ≳ 8 and for the large over-abundance of active galactic nuclei (AGNs) with respect to pre-JWST expectations. Our aim is not to provide a detailed description of BH growth, but rather to compute the maximal BH growth that can occur in cosmological models with negative ΩΛ under the simple assumption of Eddington-limited accretion onto initial light BH seeds with masses of Mseed ∼ 102 M⊙ that originated from Pop III stars.
Methods. To this aim, we developed a simple analytic framework to connect the growth of dark matter halos to the maximal growth of BHs within the above assumptions.
Results. We show such models can account for present observations assuming values of ΩΛ ≈ −1, simultaneously boosting both galaxy and AGN number counts without invoking any additional physics. This would allow us to trace the observed excess of bright and massive galaxies and the early formation of massive BHs and the abundance of AGNs to the same cosmological origin.
Key words: galaxies: formation / galaxies: high-redshift / quasars: supermassive black holes / dark energy
© The Authors 2026
 Open Access article, published by EDP Sciences, under the terms of the Creative Commons Attribution License (https://creativecommons.org/licenses/by/4.0), which permits unrestricted use, distribution, and reproduction in any medium, provided the original work is properly cited.
This article is published in open access under the Subscribe to Open model. This email address is being protected from spambots. You need JavaScript enabled to view it. to support open access publication.
1. Introduction
In recent years, major observational breakthroughs, largely provided by the James Webb Space Telescope (JWST), have severely challenged the canonical Λ cold dark matter (ΛCDM) scenario for the formation of cosmic structures. These observations revealed a significant excess of massive galaxies at z ≳ 6 (Labbé et al. 2023; Xiao et al. 2024; Casey et al. 2024) and of star forming, UV-bright galaxies at z ≳ 10 (Castellano et al. 2022; Finkelstein et al. 2022; Atek et al. 2022; Whitler et al. 2022; Robertson et al. 2024; Finkelstein et al. 2023; Pérez-González et al. 2023; Donnan et al. 2022; Harikane et al. 2023a; Bouwens et al. 2023; McLeod et al. 2023; Adams et al. 2024; Finkelstein et al. 2024; Pérez-González et al. 2025) over the pre-JWST models of galaxy formation in the ΛCDM scenario.
Such a fast growth of the galaxy stellar mass content seems to be accompanied by an even faster growth of the mass, MBH, of the supermassive black holes (SMBHs) hosted in high-redshift galaxies, which is thought to originate from the accretion of gas onto initial black hole (BH) seeds (see Volonteri et al. 2021 for a review). BH masses as high as MBH ≈ 107 − 8.5 M⊙, as inferred from the broadening of Balmer lines, have now been found at z ∼ 6 − 8.5 (Kokorev et al. 2023; Harikane et al. 2023b; Maiolino et al. 2024a; Furtak et al. 2024; Juodžbalis et al. 2024), while at higher redshifts of z ≳ 10 the observations of high-ionisation lines (Maiolino et al. 2024a) and X-ray detections (Bogdán et al. 2024; Kovács et al. 2024) have led to BH masses as high as MBH = 106.2 − 7.9 M⊙ being inferred.
These high masses pose a crucial challenge for theoretical models of BH seeding and growth due to the lack of cosmic time available for their assembly (see reviews by Inayoshi & Ichikawa 2024 and Fan et al. 2023). For instance, the assumption that the initial BH seeds are constituted by the remnants of metal-free Pop III with a mass of Mseed ∼ 102 M⊙ (Carr & Rees 1984; Abel et al. 2002) and that the accretion is Eddington-limited seems to be excluded since in the ΛCDM framework there is not sufficient time to build up such high BH masses by z ≈ 8, even if assuming continuous accretion throughout the available cosmic time.
In addition to the large masses of high-redshift BHs, the demography of the BHs in the accreting phase, that is, the active galactic nuclei (AGNs), is also at variance with pre-JWST expectations (Harikane et al. 2023b; Maiolino et al. 2024a; Juodžbalis et al. 2025; Scholtz et al. 2025; Akins et al. 2024), with a number density of AGNs exceeding the pre-JWST measurements of the quasar abundance by more than one order of magnitude, at least at intermediate luminosities. Indeed, the AGN population revealed by the JWST includes previously unseen, heavily reddened, and extremely compact (Re ≲ 100 pc) objects at 4 ≲ z ≲ 10, known as ‘little red dots’ (LRDs; Matthee et al. 2024; Furtak et al. 2023; Labbe et al. 2025; Kokorev et al. 2024; Greene et al. 2024; Akins et al. 2024; Kocevski et al. 2025). Their compact size and peculiar spectra suggest that their emission is presumably dominated by obscured AGNs, an interpretation supported by the detection of broad emission lines in possibly spectroscopically confirmed candidates (and even by a direct measurement of the accreting BH mass; see Juodžbalis et al. 2025), although alternative explanations exist (Ananna et al. 2024) that suggest that their properties might be –at least partially– explained in terms of stellar emission (see Baggen et al. 2024).
Within the context of ΛCDM, all of the above observations call for the presence of different additional astrophysical processes that must be at work at high redshifts (z ≳ 8). While several approaches have been proposed to produce an accelerated early phase of star formation and UV emission with respect to the pre-JWST expectations –such as stochastic star formation (Shen et al. 2023; Sun et al. 2023; Gelli et al. 2024) reduced dust attenuation (Ferrara 2024), lower metallicity stellar populations, or a top-heavy initial mass function (Trinca et al. 2024a; Yung et al. 2023), clumpy star formation (Somerville et al. 2025) and/or weaker supernova feedback (Dekel et al. 2023)– the presence of massive BHs at high redshifts z ≳ 8 and the large number density of AGNs are generally explained in terms of additional assumptions for the initial BH seeds and for the accretion properties of AGNs. Theoretical models that have been employed to investigate the high-redshift growth of BHs (Trinca et al. 2024b; Porras-Valverde et al. 2025; LaChance et al. 2025; Cammelli et al. 2024; Dayal & Maiolino 2026; McClymont et al. 2026; Quadri et al. 2025) can simultaneously reproduce the over-massive nature and high space densities of the observed AGNs by invoking episodic super-Eddington accretion (Madau et al. 2014; Volonteri et al. 2015) and/or assuming the existence of heavy seeds with masses of Mseed ∼ 105 M⊙ (Bromm & Loeb 2003; Begelman et al. 2006). Such seeds should form from the direct collapse of gas clouds in atomic-cooling halos with virial temperatures T ∼ 104 K characterised by a pristine gas composition to avoid fragmentation and irradiated by a Lyman-Werner radiation intense enough to dissociate H2 molecules and avoid star formation. Their formation thus requires rather peculiar and rare conditions (see e.g. Schauer et al. 2017; Latif et al. 2022). As for the super-Eddington accretion, its plausibility and effectiveness within realistic conditions provided by the large-scale cosmological environment are subject to intense ongoing studies (see e.g. Zhu et al. 2022; Ni et al. 2022; Bhowmick et al. 2022; Lupi et al. 2024).
All the above conditions for star formation and BH growth at high redshifts require substantial modification of the pre-JWST picture of galaxy formation of SMBH evolution at high redshifts, z ∼ 10, while essentially preserving the canonical picture of gradual gas conversion into stars at lower redshifts and of BH growth through Eddington-limited accretion (see e.g. Lai et al. 2024). However, an alternative possibility is that the tension between the abundance and masses of high-redshift galaxies and BHs observed by the JWST and the ΛCDM predictions originates in the assumed cosmological model. While the need for the introduction of substantial change or for more exotic physics affecting the early evolution of galaxies and BHs does not constitute conclusive evidence that the underlying cosmological model has to be revised, a growing body of independent observational evidence from cosmological probes suggests that the standard cosmological model, with dark energy (DE) described by a cosmological constant, Λ, may be incomplete. In particular, the recent measurements (Adame et al. 2025; Lodha et al. 2025b; Calderon et al. 2024; Abdul Karim et al. 2025; Andrade et al. 2025) of baryon acoustic oscillations (BAOs) by the Dark Energy Spectroscopic Instrument (DESI), when complemented with Planck cosmic-microwave-background (CMB) data and type Ia supernova (SNIa) distance modulus measurements (Scolnic et al. 2022; Brout et al. 2022; Rubin et al. 2025; Abbott et al. 2024; Sánchez et al. 2024; Vincenzi et al. 2024) yield evidence for a time-evolving, dynamical dark energy (DDE; Adame et al. 2025; Abdul Karim et al. 2025; Lodha et al. 2025a), with a confidence level ranging from ∼3σ to 4σ depending on the SNIa sample used in the constraints (Adame et al. 2025). The preference for DDE models compared to ΛCDM is robust with respect to the different parameterisations for the time evolution of DE (Lodha et al. 2025a; Giarè et al. 2024).
The most straightforward interpretation of these results is that the DE is provided by the dynamics of a quantum field, ϕ, rolling over a potential V(ϕ), which would yield a time-changing equation-of-state (EoS) parameter: ![Mathematical equation: $ w=[\dot\phi^2/2-V(\phi)]/[\dot\phi^2/2+V(\phi)] $](/articles/aa/full_html/2026/03/aa58610-25/aa58610-25-eq1.gif) (Peebles & Ratra 1988; Ratra & Peebles 1988; Wetterich 1995; Caldwell et al. 1998). The vacuum state of such a field corresponds to a cosmological constant, Λ, while the total DE density, ρDE = ρx + ρΛ, is contributed by a dynamical part with an energy density of ρx and by the contribution of the ground-state ρΛ. The observed low-redshift (z ≲ 1) accelerated expansion of the Universe (Riess et al. 1998; Perlmutter et al. 1999) only requires the total DE density, ρDE, to be positive, leaving possibilities for positive and negative values of Λ. Although the commonly explored combinations of cosmic parameters generally assume positive ρΛ, corresponding to a de Sitter (dS) vacuum, the resulting scenarios have a number of drawbacks: constructing a stable, positive vacuum energy (a dS vacuum) is notoriously difficult within string theory (Danielsson & Van Riet 2018; Vafa 2005; Palti 2019; Graña & Herráez 2021); when ΩΛ > 0 is assumed, the present cosmological constraints yield phantom-crossing behaviour of the EoS parameter, w, which evolves from values w ≤ −1 at z ≳ 1 to values w ≥ −1 at later times, thus implying a phantom phase, which would imply a negative kinetic contribution, ϕ2, to the EoS parameter w (Ludwick 2017) and violate the null energy condition (Vikman 2005; Carroll et al. 2005; Nojiri et al. 2005; Oikonomou & Giannakoudi 2022; Trivedi 2024).
(Peebles & Ratra 1988; Ratra & Peebles 1988; Wetterich 1995; Caldwell et al. 1998). The vacuum state of such a field corresponds to a cosmological constant, Λ, while the total DE density, ρDE = ρx + ρΛ, is contributed by a dynamical part with an energy density of ρx and by the contribution of the ground-state ρΛ. The observed low-redshift (z ≲ 1) accelerated expansion of the Universe (Riess et al. 1998; Perlmutter et al. 1999) only requires the total DE density, ρDE, to be positive, leaving possibilities for positive and negative values of Λ. Although the commonly explored combinations of cosmic parameters generally assume positive ρΛ, corresponding to a de Sitter (dS) vacuum, the resulting scenarios have a number of drawbacks: constructing a stable, positive vacuum energy (a dS vacuum) is notoriously difficult within string theory (Danielsson & Van Riet 2018; Vafa 2005; Palti 2019; Graña & Herráez 2021); when ΩΛ > 0 is assumed, the present cosmological constraints yield phantom-crossing behaviour of the EoS parameter, w, which evolves from values w ≤ −1 at z ≳ 1 to values w ≥ −1 at later times, thus implying a phantom phase, which would imply a negative kinetic contribution, ϕ2, to the EoS parameter w (Ludwick 2017) and violate the null energy condition (Vikman 2005; Carroll et al. 2005; Nojiri et al. 2005; Oikonomou & Giannakoudi 2022; Trivedi 2024).
On the other hand, cosmological models characterised by a composite DE sector with a negative cosmological constant (NCC) of Λ < 0 –corresponding to potentials (V(ϕ)) featuring a negative minimum, that is, an anti-dS (AdS) vacuum– appear naturally within string theory (see Maldacena 1998; specific string-inspired models with an NCC are described in Murai & Takahashi 2025; Svrcek 2006; Luu et al. 2025). In fact, they have been proposed as attractive alternatives that can satisfy the late-time acceleration constraints while remaining consistent with the other standard cosmological observations (Cardenas et al. 2003; Poulin et al. 2018; Dutta et al. 2020; Visinelli et al. 2019; Ruchika et al. 2023; Di Valentino et al. 2021; Calderón et al. 2021; Sen et al. 2022; Malekjani et al. 2024; Adil et al. 2024; Mukherjee et al. 2025; Wang et al. 2025). Indeed, recent studies have shown that such models can enhance high-redshift structure formation, making them promising candidates for explaining the JWST galaxy excess (Adil et al. 2023; Menci et al. 2024a,b; Chakraborty et al. 2025).
Motivated by such findings, we explored the impact of assuming a DDE cosmology with an NCC on the early formation of massive BHs and on the demography of AGNs. Specifically, we investigated whether NCC models alone can account for the recent JWST observations without introducing super-Eddington accretion phases or an initial population of heavy BH seeds; we did so to assess whether such cosmological scenarios could constitute a viable, unified solution to all the issues raised by the high-z observations of the JWST. Following the same line as our earlier works, we adopted a simple description to relate the stellar properties of galaxies to their dark matter (DM) halo, which is known to provide an excellent statistical description of the galaxy population at z < 8, while assuming initial BH seeds with masses of Mseed ≈ 102 M⊙ originating from Pop III stars, and Eddington-limited accretion. Under such conditions, we then computed the maximal growth (corresponding to continuous accretion at the Eddington rate) of massive BHs assuming NCC cosmologies, and we computed the corresponding maximal masses of high-redshift SMBHs and the impact on the AGN demography. The paper is organised as follows. In Sect. 2, we describe the NCC DE models and their impact on the Universe expansion and on the growth of cosmic structures. In Sect. 3, we recall how the abundance of DM halos is derived in such cosmological models and how we relate the DM halo mass of the host galaxies to the SMBH masses and to the AGN accretion rate while assuming continuous accretion at the Eddington limit and BH seeds with masses of 102 M⊙. Based on such a model, in Sect. 4 we compare the growth of BH masses and the AGN abundance at z ≳ 5 with recent JWST observations. Section 5 is devoted to a discussion, while in Sect. 6 we present our conclusions.
2. Dark-energy models
We considered a DE sector consisting of a cosmological constant, Λ ≷ 0, with an associated vacuum energy density of ρΛ = Λ/8πG –which can be positive or negative– corresponding to a dS or anti-de Sitter (AdS) vacuum, respectively. On top of this, we considered a DE component with an energy density of ρx(a) > 0, which evolves with the expansion factor a = 1/(1 + z). Rather than focusing on a specific model for the evolving DE component, we parametrise the time evolution of its EoS parameter, wx(a), using the widely adopted Chevallier–Polarski–Linder form (Chevallier & Polarski 2001; Linder 2003):
 (1)
(1)
where w0 describes the behaviour of DE in the local Universe, and the value of wa describes its evolution back in cosmic time. This parametrisation captures the EoS behaviour in several physical DE models as discussed in Linder (2003, 2006, 2008b,a) and Scherrer (2015, see also Perkovic & Stefancic 2020 for a comparison among different parametrisations proposed in the literature) and allowed us to compare them with earlier works.
The energy density of the evolving DE component thus evolves according to the following:
![Mathematical equation: $$ \begin{aligned} \rho _x(a)=\Omega _x\rho _{\rm c0}a^{-3(1+w_0+w_a)}e^{ \left[ -3w_a\,(1-a) \right] }\,, \end{aligned} $$](/articles/aa/full_html/2026/03/aa58610-25/aa58610-25-eq3.gif) (2)
(2)
where Ωx ≡ ρx(1)/ρc0 is the density parameter of the evolving DE component and ρc0 is the critical density. Assuming a spatially flat Friedmann–Lemaître–Robertson–Walker universe, the evolution of the Hubble rate (with respect to its present value, H0) in the matter-dominated era is governed by the following equation:
![Mathematical equation: $$ \begin{aligned}&E^2(a)\equiv H^2(a)/H_0^2=\Omega _m\,a^{-3} + \Omega _{\Lambda } + \Omega _xa^{-3(1+w_0+w_a)} e^{ \left[ -3w_a (1-a) \right] }, \end{aligned} $$](/articles/aa/full_html/2026/03/aa58610-25/aa58610-25-eq4.gif) (3)
(3)
where Ωm is the matter density parameter, ΩΛ ≡ Λ/3 is the density parameter associated with the cosmological constant, and Ωm + ΩΛ + Ωx = 1 holds. The density parameter of the combined DE sector is ΩDE ≡ Ωx + ΩΛ. Although ΩΛ can be negative, the density parameter associated with the total DE density has to be ΩDE ≈ 0.7 to be able to drive the observed cosmic acceleration at low redshift: z ≲ 1.
We notice that, in order to agree with observations, more negative values of ΩΛ need to be compensated by more negative values of wx, moving towards the phantom regime (Visinelli et al. 2019; Sen et al. 2022; Adil et al. 2023). These considerations lead to upper limits of the order of unity in |ΩΛ|, corresponding to a negative vacuum energy density ≲10−123 in Planck units. Although this may seem to represent the usual problem related to the small absolute value of the cosmological constant, recent studies (Demirtas et al. 2021, 2022) have shown that super-symmetric AdS4 vacua of the above magnitude naturally arise in the framework of string theory.
3. Method
We built a flexible and transparent analytic model that can provide upper limits to the growth of galaxies and their central SMBHs associated with DM structure formation in a DDE framework. The steps we followed in our procedure are listed below.
-
We first generated a sample of host halo masses extracted from the halo mass function at an initial redshift of zi = 20.
-
We then grew each central DM halo above 3.5σ of the primordial density field along its main progenitor branch using analytical recipes.
-
Within each DM halo, we grew a BH via mergers and accretion. An upper limit to the growth of BHs due to mergers was obtained assuming that the fractional increase via mergers is directly linked to the fractional growth in host DM mass, while the growth via accretion is assumed to be a continuous process at the Eddington limit.
-
From our mock sample of central DM haloes and their BHs, we built the mean BH mass-halo mass relation, which we then used to convert the halo mass function into a BH mass function.
-
From the BH mass function, we then derived the AGN luminosity function, which is a straightforward step as in our approach all BHs are continuously accreting (duty cycle equal to unity) at the Eddington limit.
-
For completeness, we also computed the implied galaxy UV luminosity function at z ≳ 10 from our models.
The last step allowed us to make a direct comparison with current data on the z ∼ 5 − 6 AGN luminosity function, although the most revealing comparisons are the ones at z ≳ 7. We note that in principle it would be more straightforward to carry out a direct comparison with the BH mass function, but current estimates are mostly available at z < 6, a time at which the effects of a DDE wear off. We also stress that for the conversion from halo-to-BH mass function we did not include any scatter as we already assumed a strictly maximal growth for each BH, given that in our modelling even the tiniest growth in the DM host halo induced parallel growth in the central BH, and the latter grew further via constant Eddington-limited accretion. We remind the reader that we did not include any super-Eddington accretion as our aim was to understand whether a strictly Eddington-limited accretion starting from Pop III BH seeds could be a viable model with which to match the newest high-z AGN data in the context of NCC cosmologies.
3.1. Abundance of collapsed objects
The abundance of collapsed objects in the Universe is described by the mass function dN(M)/dM. We briefly recall its computation in NCC cosmologies for different values of ΩΛ following the lines in Menci et al. (2022).
We based our work on the Press & Schechter approach (Peacock 1999; Padmanabhan 2002; Dodelson 2003) that relates the mass distribution to the properties of the linear perturbation density field. These are enclosed in the variance σ(M, a) of matter density fluctuations smoothed on the comoving scale corresponding to the mass scale M. In terms of the linear power spectrum of matter density fluctuations, PL(k, a), computed at the cosmic expansion factor a, the variance is
 (4)
(4)
where W(k, R) = 3[sin(kR)−kRcos(kR)]/(kR)3 is the Fourier transform of the real-space spherical top-hat window function of radius  , and
, and  is the mean comoving background matter density. The linear power spectrum, PL(k, z), of matter density fluctuations as a function of wave number, k, at a given expansion factor, a, can further be expressed as
 (5)
(5)
where P0 is a normalisation constant, which is fixed using the present-day mass variance (σ8) on a scale of 8 h−1 Mpc; T(k) is the CDM matter transfer function; and D(a) is the linear growth factor normalised to one at present cosmic time. Assuming that halos form when the linear perturbations reach critical linear overdensity, δc, for collapse, the mass function takes the general form
 (6)
(6)
where ν = δc/σ(M, a) is the critical height of density perturbations relative to the r.m.s. value of the perturbations. In the following, we adopt the Sheth and Tormen (Sheth & Tormen 1999) mass function
 (7)
(7)
where the parameters A = 0.32, a = 0.71, and q = 0.3 are related to the physics of collapse.
The growth factor, D(a), plays a major role in determining the extension to large masses of the mass distribution. The faster the growth of density perturbations, the larger the probability of rare, high-mass overdensities reaching the threshold for collapse. The evolution of the growth factor is governed by the following equation (see e.g. Adil et al. 2023 and references therein):
![Mathematical equation: $$ \begin{aligned} \delta {{\prime \prime }} + \left[ \frac{3}{a}+\frac{E\prime (a)}{E(a)} \right]\delta {\prime } -\frac{3}{2}\frac{\Omega _m}{a^5 E^2(a)}\delta =0\,, \end{aligned} $$](/articles/aa/full_html/2026/03/aa58610-25/aa58610-25-eq11.gif) (8)
(8)
where ′ indicates a derivative with respect to the scale factor a, and E(a)≡H(a)/H0 denotes the normalised expansion rate in Eq. (3). The equation shows how the growth of perturbations through gravitational instability is counteracted by a Hubble friction term due to the expansion of the Universe. For each chosen set of cosmological parameters determining expansion rate Eq. (3), we numerically solved Eq. (8).
Inspection of Eqs. (3) and (8) immediately shows the effect of introducing a negative Λ. At early times, a → 0, the term related to matter density, Ωm a−3, dominates over all other terms, so H(a) (and hence D(a)) is almost independent of the other cosmological parameters. Analogously, in the late time regime a → 1 the expansion rate in Eq. (8) –and hence the growth factor D(a)– reduces to exactly the ΛCDM case since Ωx + ΩΛ = 1 − Ωm ≈ 0.7, and again assuming an NCC has no effect on the growth of perturbations. However, at intermediate redshifts, z ∼ 10 − 20, the value of ΩΛ appreciably affects H(a); Eq. (3) shows that for decreasing values of ΩΛ (and particularly for negative values), a slower expansion rate of H(a) is obtained, resulting in larger growth factors in Eq. (8). Thus, at such redshifts, we expect a larger abundance of massive objects compared to ΛCDM, as shown in Fig. 1 in Menci et al. (2024b).
Extending the above Press & Schechter approach to derive the whole growth history of the DM halos through subsequent merging of DM condensations (see e.g. Lacey & Cole 1993), it is possible to derive the mass growth of the main branch in a DM growth history due to accretion and merging of haloes. This reads as (Neistein et al. 2006; see also Liu et al. 2024; Correa et al. 2015)
![Mathematical equation: $$ \begin{aligned} {1\over M(a)} {dM\over dt}=-{\sqrt{2\over \pi }}\,{1\over \sqrt{\sigma ^2(M/q)- \sigma ^2(M)}}\,{d[\delta _c/D(t)]\over da} ,\end{aligned} $$](/articles/aa/full_html/2026/03/aa58610-25/aa58610-25-eq12.gif) (9)
(9)
where q can be computed to be in the q = [2.1 − 2.3] range for flat cosmologies, with an uncertainty that is an intrinsic property of the extended Press & Schecter theory. The comparison with up-to-date N-body simulations (Liu et al. 2024) showed that the above predictions match the simulation results with typical values for the residuals ≲0.2. The authors of Correa et al. (2015) showed that in the high-redshift regime of interest to us, the above rate can be written as
 (10)
(10)
leading to an exponential growth of the halo mass (as already obtained by Wechsler et al. 2002). When the mass, M, is expressed in units 1012 M⊙, the normalisation takes the value A = 102 h yr−1, and  depends on the final mass, M0, of the parent halo at z = 0. We verified that our mass-growth histories (computed with small time steps according to the prescriptions in Neistein et al. 2006) agree with those obtained in the above-mentioned papers.
3.2. The growth of BHs and stars in the host dark matter halos
To compute the growth of the BHs and stellar mass hosted in the evolving DM halos, we adopted a simplified approach; the aim was not to achieve detailed and precise predictions for the abundance of SMBHs, but rather to derive the maximal BH growth that can be achieved in different NCC cosmologies under the most conservative assumptions for the physics of BH accretion and star formation. To this aim, we first considered a grid of halo masses, M, at the initial redshift zi = 20, for which we computed the growth of the halos according to Eq. (9). This allowed us to represent the average mass growth of each mass bin. Following an approach widely used in the literature (see e.g. Volonteri et al. 2003; Barausse 2012; Dayal et al. 2019), we populated all halos collapsing from the large ≳3.5σ peaks of the primordial density field (Madau & Rees 2001; Volonteri et al. 2003); in the ΛCDM case, this corresponds to populating halos with masses of M ≥ 1.1 h−1 107 M⊙ [(1 + z)/20]−3/2 (Volonteri et al. 2003).
Since we were interested in computing the maximal BH mass growth in the light-seeds scenario, we started from BH seeds with masses of Mseed = 102 M⊙. From this initial mass, BHs can grow both by accretion and merging. Since our aim was to derive the maximal SMBH growth that can be achieved in different NCC cosmologies, we assumed continuous accretion at the Eddington limit:
 (11)
(11)
where G is the gravitational constant, mp is the proton mass, σT is the Thomson scattering optical depth, ϵr is the BH radiative efficiency, and c is the speed of light. The BH mass accreted in the time step Δa (in terms of the expansion factor a) as MBH(a + Δa) = MBH(a)+(1 − ϵr)M′ed(a)⋅Δa, where we assume a fiducial value ϵr = 0.1 for the radiative efficiency of accreting BHs. This allowed us to compute the BH mass in each DM halo at the next time step.
In the spirit of maximising the BH growth in a given cosmological scenario, we assumed an instantaneous merging scenario. We assumed that BH masses merge following the same relative rate of their host halos given by Eq. (9), that is, that BH merging promptly follows that of their host halos. After updating the BH masses hosted in each DM halo after the above assumption, we iterated the procedure to obtain the average BH mass, MBH, hosted in halos with a DM mass of M at a cosmic epoch of t, up to a final time corresponding to zf = 4. This procedure is strictly valid for the main branch of the merging histories of DM halos. However, here we focused on the high-redshift evolution of DM halos (and SMBHs hosted therein), through which, due to the extremely rapid merging events, the mass growth of halos can be described on average by the continuous mass accretion onto a main branch in Eq. (9).
As for the average star formation rate associated with DM halos, we adopted a phenomenological representation of our knowledge of galaxy formation before the JWST era, thus assuming that the same physical processes that shape the baryon conversion into stars at z ≲ 10 also drive star formation at higher redshifts. Following the approach in Menci et al. (2024b), the DM mass, M, is related to the star formation rate of galaxies by ṁ∗ = ϵ(M) fb M, where fb is the cosmic baryon fraction. The efficiency ϵ(M) for the conversion of baryons into stars is taken from Mason et al. (2015, see their Fig. 1). This is a redshift-independent relation characterised by a maximal efficiency at masses M ≈ 1012 M⊙, and constitutes a phenomenological representation of our knowledge about galaxy formation before the JWST era. The star formation rate is related to the UV luminosity L through the relation ṁ∗/M⊙ yr−1 = kUV L/erg s−1 Hz−1 with kUV = 0.7 10−28 assuming a Chabrier initial mass function (Madau et al. 2014), such that L ∝ ϵ(M) M. From the star formation rate above, the stellar mass, m*, associated with a DM halo, M, can be computed analytically. Instead of performing time integration of ṁ∗ over the progenitors, we adopted a simple phenomenological approach to that proposed by Behroozi & Silk (2015) based on observed average relations. Measurements of the M*-M relation at z = 4 − 10 show that their relation can be approximated as a power law M* = M*0 (M/M0)α for the DM masses of M ≤ 5 × 10¹¹ M⊙ considered here (see Behroozi & Silk 2015; Behroozi et al. 2019, 2020). As noted by Behroozi & Silk (2015), this implies that the stellar and DM specific accretion rates are related by Ṁ∗/M = α Ṁ/M. The stellar mass, M*, can then be computed from Ṁ∗ and from the DM specific accretion rate in Eq. (9) from the observed values of α, which are within the α = [1 − 1.5] range (Behroozi & Silk 2015; Behroozi et al. 2019, 2020). The uncertainties in M* associated with the above range of values for α were considered when we derived the stellar mass, M*. In the following, all distributions dN(X, z)/dX = [dN(M, z)/dM] (dM/dX) of any of the above observables X (i.e. the UV luminosity of galaxies, their star formation rate, stellar mass, BH mass, and AGN luminosity) were derived from the DM halo mass function Eq. (6) after connecting the halo mass M to the observable X following the modelling described above.
3.3. The cosmological framework
In our previous papers (Menci et al. 2024a,b), we showed that quintessential models (with w0 ≥ −1 and wa ≥ 0) with negative ΩΛ can provide a solution to the excess of both massive galaxies at z ≳ 6 and of luminous galaxies at z ≳ 10 observed by the JWST. This is due to the accelerated growth of cosmic structures, as seen in Fig. 1 in Menci et al. (2024b). In addition, such models do not lead to the crossing of the phantom regime, so w remained in the non-phantom regime, w ≥ −1, throughout the cosmic history.
Since our aim here was to show that such cosmologies can provide a simultaneous solution to both the above excess and to the early growth of SMBHs at high redshifts (without invoking heavy seeds or super-Eddington accretion), in the following we focus on such combinations. We further restricted the parameter space by requiring their consistency with the existing cosmological constraints. To this aim, we considered the following datasets:
-
(i) The latest data release from the Atacama Cosmology Telescope ACT DR6 (Louis et al. 2025) with a Planckcut likelihood from the Planck PR3 data release (Aghanim et al. 2020, for details of the data combination, see Mukherjee et al. 2025 and references therein).
-
(ii) The DESI-BAO DR2 (Abdul Karim et al. 2025) measurements for the 0.1 < z < 4.2 redshift range.
-
(iii) The DES-SN5YR (Abbott et al. 2024; Sánchez et al. 2024) sample for SNIa luminosity measurements in the 0.1 < z < 1.13 redshift range complemented by low-z SNIa measurements in the 0.025 < z < 0.1 redshift range.
We did not consider constraints from re-ionisation. Although recent works in the literature (Chakraborty et al. 2025) have shown that the measurements of the cosmic re-ionisation history may significantly restrict the parameter space of DDEs with a NCC, strongly limiting their boost to structure formation, the modeling of re-ionisation is still affected by appreciable uncertainties. For instance, in the above-mentioned paper, only the contribution of galaxy UV emission was considered as a source of re-ionisation, while, especially in view of our results below, a significant fraction of UV ionising flux can result from AGN emission.
We used Markov chain Monte Carlo (MCMC) methods to derive constraints on our set of cosmological parameters (for a full discussion of the methodology and the resulting constraints, we refer the reader to Mukherjee et al. (2025). In Fig. 1, we show the allowed region in the w0 − wa plane for the data combination mentioned above. As one can see, there is a small but finite region in the parameter space that is always non-phantom and where ΩΛ is negative.
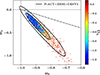 |
Fig. 1. 2D confidence contour in w0 − wa plane for our model using CMB+DESI+DES data combination. The dash-dotted line is a phantom line. Above this line, the allowed region is always non-phantom, whereas below it the allowed region is early phantom and late non-phantom. Dots represent different MCMC realisations. The colour-code shows the value of ΩΛ that allows for consistency with the above cosmological probes. |
We explore the properties of such a region in more detail in Fig. 2, where we focus on non-phantom combinations (w0, wa) that match (within 2σ) the cosmological observations above. In the top left panel, we show the average values of ΩΛ corresponding to such (w0, wa) combinations. In the upper right panel of Fig. 2, we show the values of σ8 and of Ωm, with the average value of ΩΛ associated with the non-phantom region of the w0, wa plane. For the same region, the whole distribution of ΩΛ values resulting from our MCMC procedure is shown in the bottom left.
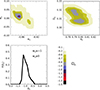 |
Fig. 2. Top left: Based on our MCMC procedure for the selection of (w0-wa, ΩΛ) combinations consistent (at 2-σ level) with the considered cosmological probes, we show as the average ΩΛ as a function of (w0-wa) coloured contours. The colour-code is shown by the bar in the bottom right of the figure. Top right: For combinations (w0 ≥ −1, wa ≥ 0) considered here, we show the values of Ωm and σ8 consistent (at a 2-σ level) with the considered cosmological probes. The colour-code refers to the average values of ΩΛ corresponding to each combination, as shown by the bottom bar. Bottom left: Probability distribution of ΩΛ resulting from our MCMC procedure for the combinations (w0 ≥ −1, wa ≥ 0) considered here. |
Based on the results above, we considered a fiducial choice of w0 = −0.98 wa = 0.08 for the EoS parameter, allowing ΩΛ to assume all values in the distribution shown in the bottom left panel of Fig. 2. This ensured that the model considered here could be made consistent with the observed abundance of massive galaxies at z ≳ 6 (see Menci et al. 2024a) and with the observed luminosity function of bright galaxies measured by the JWST at z ≳ 10, which we show in Fig. 3. We checked that our results do not differ appreciably when other combinations (w0,wa) are considered among the values defining the non-phantom regime (w0 ≥ −1 – wa ≥ 0) for the EoS parameter represented in the upper right quadrant of Fig. 2. An inspection of Fig. 3 shows that values of ΩΛ ≈ −1 can yield an abundance of high-redshift bright galaxies close to the observed values.
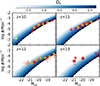 |
Fig. 3. High-redshift UV luminosity functions of galaxies for our fiducial combination of (w0, wa) in the different redshift bins shown by the labels. The colour-code corresponds to the different values of ΩΛ as shown in the top bar, while the dashed line marks the results for the standard ΛCDM cosmology. We compared with measurements from Finkelstein et al. (2023, diamonds), Donnan et al. (2023, stars), McLeod et al. (2023, upward triangle), Harikane et al. (2023a, open square), Adams et al. (2024, pentagon), Bouwens et al. (2022, circle), and Robertson et al. (2024, downward triangle). |
4. Results
Based on the above framework, we proceeded to compute the growth of SMBHs in the scope of NCC cosmologies. As discussed in Sect. 2, our aim was not to achieve detailed and precise predictions for the abundance of BHs, but rather to derive the maximal BH growth that can be reached in different NCC cosmologies under the most conservative assumptions for the physics of BH accretion and star formation. Following the above discussion, we populated all halos collapsing from the large ≳3.5σ peaks of the primordial density with initial BH seeds with masses of Mseed ≈ 102 M⊙ and followed their evolution as described in Sect. 3 assuming continuous Eddington-limited accretion. Under the assumptions above, the maximal growth of BHs hosted in halos corresponding to 3.5 peaks of the density field is shown in Fig. 4 for our fiducial cosmological framework for different values of ΩΛ.
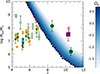 |
Fig. 4. Maximal growth of BHs from Mseed = 102 M⊙ at zseed = 25 is shown for the different values of ΩΛ shown in the colour bar for our fiducial combination w0 = −0.98, wa = 0.08; the dashed line marks the result for the standard ΛCDM cosmology. To maximise the BH mass, we assumed continuous Eddington-limited accretion. We compared these models to BHs measured by Bogdán et al. (2024, solid square), Furtak et al. (2024, cross), Greene et al. (2024, empty pentagons), Juodžbalis et al. (2024, upward triangle), Harikane et al. (2023a, filled diamonds), Maiolino et al. (2024a, downward triangles), Maiolino et al. (2024b, solid circle), and Kocevski et al. (2023, solid pentagon). |
As obtained in previous works in the literature (see e.g. Dayal 2024 and references therein), in the ΛCDM cosmology with light BH seeds M⊙ = 102 M⊙ only BHs with masses of MBH ≲ 105 M⊙ can be in place by z ≈ 10, and MBH ≲ 108 M⊙ by z ≈ 8, even under the assumption of continuous Eddington accretion. On the other hand, assuming NCC cosmologies yields an accelerated growth of BHs at z ≥ 10 (see Eq. (8)) so as to allow for the presence of BHs as massive as MBH ∼ 107 M⊙ at z ∼ 10 for ΩΛ ≈ −1 without the need for Super-Eddington accretion or for heavy BH seeds. This shows that NCC cosmology can constitute an alternative solution to the problem posed by the presence of massive BHs at early cosmic epochs.
Motivated by such results, we proceeded to investigate whether the same cosmology can account for the other problem posed by the recent JWST observations, namely, the large number density of AGNs identified by the JWST, both as type- I and type-II AGNs (see e.g. Harikane et al. 2023b; Maiolino et al. 2024a; Scholtz et al. 2025) and as LRDs (see e.g. Matthee et al. 2024; Greene et al. 2024; Kokorev et al. 2024; Akins et al. 2024). These studies show that the number density of JWST-detected systems lies between 1 and 2 dex larger than the extrapolation of the UV quasar luminosity function at z ≳ 6 (Shen et al. 2020) and higher than the estimated density from deep X-ray observations (Giallongo et al. 2015, 2019). Such large number densities exceed the predictions of ΛCDM models implementing Eddington-limited models for the BH accretion by ∼1 order of magnitude (see Trinca et al. 2024b and references therein).
Figure 5 shows the AGN bolometric luminosity function computed in different NCC models at z = 5 − 7 and z = 7 − 9. Again, our aim was not to test a detailed description of AGN accretion, but rather to show the maximal AGN abundance that can be achieved in any given cosmological model under the assumption of Eddington-limited accretion and BH seeds with masses of 102 M⊙. The model results were compared with the recent estimates by Akins et al. (2024) based on JWST observations; the pre-JWST measurements by Shen et al. (2020) are also shown for comparison.
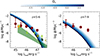 |
Fig. 5. Bolometric luminosity function of AGNs under the assumption of continuous accretion at the Eddington rate shown for the different values of ΩΛ in the colour bar for our fiducial combination w0 = −0.98, wa = 0.08; the dashed line marks the result for the standard ΛCDM cosmology. We compared with the measurements of Akins et al. (2024), which are based on JWST observations (red circles), derived under the assumption that the emission of LRDs is entirely contributed by AGNs, and with those of Harikane et al. (2023a, orange pentagon). For comparison, we also show the pre-JWST measurements by Shen et al. (2020) as a shaded area, by Glikman et al. (2011, square), Grazian et al. (2023, diamonds), and the X-ray measurement through Chandra COSMOS data by Barlow-Hall & Aird (2025, triangles) and Barlow-Hall et al. (2023, star). |
As obtained in previous works in the literature (see e.g. Trinca et al. 2024b), in the Eddington-limited accretion scenario the predicted bolometric luminosity functions predicted in the ΛCDM cosmology drop by more than two orders of magnitude below the number density estimated by Akins et al. (2024) at the bright end of the distribution. Also in this case, NCC models alleviated the discrepancy between observations and predictions, although the brightest point at z ≥ 7 is still under-predicted.
However, the observational bolometric luminosity function (Akins et al. 2024) reported here relies on the assumption that LRD emission is dominated by AGNs. In fact, several studies suggest that both the stellar and the AGN components contribute to the spectral energy distribution (see e.g. Volonteri et al. 2024; Taylor et al. 2024), thus resulting in a lower estimated AGN luminosity. Although this could bring the observed AGN luminosity function in better agreement with models (including those within the ΛCDM framework), this would result in a further component contributing to the stellar mass function and hence appreciably worsen the problems of current galaxy formation models in matching the abundance of massive galaxies at high redshifts of z ≳ 6.
This is illustrated in Fig. 6, where we compare the stellar mass function of galaxies in different cosmologies with the JWST measurements by Weibel et al. (2024). We show the increase in the abundance of massive galaxies that would be obtained if the emission of all LRDs in the sample by Akins et al. (2024) were contributed by stars. In this extreme case, a strong excess relative to the ΛCDM predictions would exist at z ≈ 7, while a much better agreement would be obtained for NCC models. Although such an excess is still to be confirmed by extending the portion of the sample which include MIRI measurements, this indicates that the tension with the ΛCDM predictions yielded by the LRD abundance would show up either in the luminosity function of an AGN (at least under the assumption of Eddington-limited accretion) or in the stellar mass function. Future measurements that can increase the accuracy of stellar mass measurements will help to address the issue.
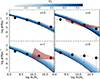 |
Fig. 6. Stellar mass function of galaxies for the different values of ΩΛ shown in the colour bar for our fiducial combination w0 = −0.98, wa = 0.08; the dashed line marks the result for the standard ΛCDM cosmology. We compared the JWST measurements by Weibel et al. (2024) with the estimate by Akins et al. (2024, shaded area), which considered the additional contribution by LRDs under the assumption that the emission was entirely contributed by stars. |
5. Discussion and conclusions
Motivated by recent observational indications for a dynamical behaviour of the DE, we explored the possible impact of assuming DDE models with NCC on the growth of massive BHs at high redshifts and on the abundance of AGNs. We show that such cosmological models can account for the observed presence of massive BHs with masses of MBH ≳ 107 M⊙ observed at z ≳ 8 and for the large over-abundance of AGNs at z ≳ 6 with respect to pre-JWST data, without the need to invoke super-Eddington accretion or massive BH seeds. As shown in previous results, the same NCC models can also account for the large abundance of bright galaxies observed by the JWST at z ≳ 10 and the abundance of massive galaxies at z ≳ 6, both largely exceeding the pre-JWST expectation in a ΛCDM universe.
We stress that each of the above observations can in principle be explained by a variety of different astrophysical processes that should become dominant at high redshifts, as discussed in the introduction. Nevertheless, recent results from different cosmological probes suggest that a departure from ΛCDM towards DE models may be necessary. Indeed, the indications for an emerging crack in the cosmological constant paradigm are increasing as new analyses of the DESI results (in combination with other cosmological probes) are performed with a variety of different techniques; for example, in Chaudhary et al. (2026) several DE scenarios were explored, along with cosmologies allowing for spatial curvature, using Metropolis-Hastings MCMC techniques, finding strong statistical evidence for DDE behaviour; such a conclusion has been confirmed by analyses extended to consider a wider range of cosmological datasets including DESI DR2 BAO and Lyα data, CMB compressed likelihoods, Big Bang nucleosynthesis, cosmic chronometers, multiple SNeIa by Capozziello et al. (2026), and analyses adopting model-independent techniques to compare the DESI DR1 and DR2 predictions for the ΛCDM model and DDE model for different redshift ranges (Chaudhary et al. 2025). The mounting indications of a departure from ΛCDM call for an investigation of the impact of the emerging cosmological scenarios on the interpretations of the JWST observations independently of the possible astrophysical interpretations. Indeed, as shown here, such a new cosmological framework alone could already account for the enhanced abundances of galaxies and AGNs detected at high redshifts observed by the JWST. Even if future observations confirmed a downward rescaling of the currently high AGN abundances or BH masses, such as in the ‘BH envelope’ interpretation (e.g. Umeda et al. 2025, and references therein), NCC cosmologies would still represent a viable background framework to facilitate structure formation without invoking extreme values of the star formation efficiencies or too large initial BH seeds and/or too prolonged super-Eddington accretion phases. More specifically, we found that NCC models with non-phantom behaviour, consistently with the results of cosmological probes, can account for the JWST observations concerning the properties of the BH, AGN, and galaxy populations at high redshifts. We stress that the region of parameter space that we focused on (see Sect. 3.3) was selected on the basis of consistency with cosmological probes only, that is, without considering possible constraints from the observed cosmic re-ionisation history. Although a recent work (Chakraborty et al. 2025) pointed out that the region of the parameter space we investigated can be significantly restricted when such constraints are included, such a result was obtained under the assumption that re-ionisation is entirely driven by galactic emission; the assumed escape fraction adopted in such work is based on the same assumption. Here, however, we show that in NCC scenarios a relevant population of AGNs is present at high redshift, with a duty cycle much larger than that of the local Universe, potentially contributing to the re-ionisation and thus relaxing the constraints on the parameter space. We plan to explore the impact of the assumed cosmological scenario on the cosmic re-ionisation history in detail in a subsequent paper, taking into account the contribution of both galaxies and AGNs, with the inclusion of a realistic model to relate the AGN escape fraction with their feedback on the intergalactic gas.
From a theoretical point of view, our results show a NCC DE model with a non-phantom EoS constitutes an attractive possibility. In fact, such models (i) are naturally motivated in the context of string theory, (ii) allow for consistency with latest CMB+BAO+SN observations without invoking non-phantom behaviour for the DE, and (iii) yield a finite lifetime for the Universe with re-collapse happening in the future, as shown in Mukherjee et al. (2025). Given that such a theoretically motivated and observationally consistent model can indeed explain the growth of massive BHs and abundances of AGNs at high redshift, as confirmed by recent JWST measurements, such a model is highly attractive for pursuit as a viable cosmological setup.
Acknowledgments
INAF Theory Grant “AGN-driven outflows in cosmological models of galaxy formation”, INAF Mini-grant “Reionization and Fundamental Cosmology with High-Redshift Galaxies”, and INAF GO Grant “Revealing the nature of bright galaxies at cosmic dawn with deep JWST spectroscopy”. PM acknowledges funding from the Anusandhan National Research Foundation (ANRF), Govt of India, under the National Post-Doctoral Fellowship (File no. PDF/2023/001986). AAS acknowledges the funding from ANRF, Govt of India, under the research grant no. CRG/2023/003984. PM and AAS acknowledge the use of the HPC facility, Pegasus, at IUCAA, Pune, India.
References
- Abbott, D. C. T. M. C., Acevedo, M., Aguena, M., et al. 2024, ApJ, 973, L14 [NASA ADS] [CrossRef] [Google Scholar]
- Abdul Karim, M., Aguilar, J., Ahlen, S., et al. 2025, Phys. Rev. D, 112, 083515 [Google Scholar]
- Abel, T., Bryan, G. L., & Norman, M. L. 2002, Science, 295, 93 [CrossRef] [Google Scholar]
- Adame, A., Aguilar, J., Ahlen, S., et al. 2025, JCAP, 2025, 021 [CrossRef] [Google Scholar]
- Adams, N. J., Conselice, C. J., Austin, D., et al. 2024, ApJ, 965, 169 [NASA ADS] [CrossRef] [Google Scholar]
- Adil, S. A., Mukhopadhyay, U., Sen, A. A., & Vagnozzi, S. 2023, JCAP, 10, 072 [Google Scholar]
- Adil, S. A., Akarsu, O., Di Valentino, E., et al. 2024, Phys. Rev. D, 109, 023527 [CrossRef] [Google Scholar]
- Aghanim, N., Akrami, Y., Ashdown, M., et al. 2020, A&A, 641, A6 [Erratum: A&A, 652, C4 (2021)] [NASA ADS] [CrossRef] [EDP Sciences] [Google Scholar]
- Akins, H. B., Casey, C. M., Lambrides, E., et al. 2024, arXiv e-prints [arXiv:2406.10341] [Google Scholar]
- Ananna, T. T., Bogdán, A., Kovács, O. E., Natarajan, P., & Hickox, R. C. 2024, ApJ, 969, L18 [NASA ADS] [CrossRef] [Google Scholar]
- Andrade, U., Paillas, E., Mena-Fernández, J., et al. 2025, Validation of the DESI DR2 Measurements of Baryon Acoustic Oscillations from Galaxies and Quasars [Google Scholar]
- Atek, H., Shuntov, M., Furtak, L. J., et al. 2022, MNRAS, 519, 1201 [Google Scholar]
- Baggen, J. F. W., van Dokkum, P., Brammer, G., et al. 2024, ApJ, 977, L13 [NASA ADS] [CrossRef] [Google Scholar]
- Barausse, E. 2012, MNRAS, 423, 2533 [NASA ADS] [CrossRef] [Google Scholar]
- Barlow-Hall, C. L., & Aird, J. 2025, arXiv e-prints [arXiv:2506.16145] [Google Scholar]
- Barlow-Hall, C. L., Delaney, J., Aird, J., et al. 2023, MNRAS, 519, 6055 [CrossRef] [Google Scholar]
- Begelman, M. C., Volonteri, M., & Rees, M. J. 2006, MNRAS, 370, 289 [NASA ADS] [CrossRef] [Google Scholar]
- Behroozi, P. S., & Silk, J. 2015, ApJ, 799, 32 [NASA ADS] [CrossRef] [Google Scholar]
- Behroozi, P., Wechsler, R. H., Hearin, A. P., & Conroy, C. 2019, MNRAS, 488, 3143 [NASA ADS] [CrossRef] [Google Scholar]
- Behroozi, P., Conroy, C., Wechsler, R. H., et al. 2020, MNRAS, 499, 5702 [NASA ADS] [CrossRef] [Google Scholar]
- Bhowmick, A. K., Blecha, L., Ni, Y., et al. 2022, MNRAS, 516, 138 [NASA ADS] [CrossRef] [Google Scholar]
- Bogdán, Á., Goulding, A. D., Natarajan, P., et al. 2024, Nat. Astron., 8, 126 [Google Scholar]
- Bouwens, R. J., Illingworth, G. D., van Dokkum, P. G., et al. 2022, ApJ, 927, 81 [NASA ADS] [CrossRef] [Google Scholar]
- Bouwens, R., Illingworth, G., Oesch, P., et al. 2023, MNRAS, 523, 1009 [NASA ADS] [CrossRef] [Google Scholar]
- Bromm, V., & Loeb, A. 2003, ApJ, 596, 34 [Google Scholar]
- Brout, D., Scolnic, D., Popovic, B., et al. 2022, ApJ, 938, 110 [NASA ADS] [CrossRef] [Google Scholar]
- Calderón, R., Gannouji, R., L’Huillier, B., & Polarski, D. 2021, Phys. Rev. D, 103, 023526 [CrossRef] [Google Scholar]
- Calderon, R., Lodha, K., Shafieloo, A., et al. 2024, JCAP, 2024, 048 [Google Scholar]
- Caldwell, R. R., Dave, R., & Steinhardt, P. J. 1998, Phys. Rev. Lett., 80, 1582 [Google Scholar]
- Cammelli, V., Monaco, P., Tan, J. C., et al. 2024, MNRAS, 536, 851 [Google Scholar]
- Capozziello, S., Chaudhary, H., Harko, T., & Mustafa, G. 2026, Phys. Dark Universe, 51, 102196 [Google Scholar]
- Cardenas, R., Gonzalez, T., Leiva, Y., Martin, O., & Quiros, I. 2003, Phys. Rev. D, 67, 083501 [Google Scholar]
- Carr, B. J., & Rees, M. J. 1984, MNRAS, 206, 801 [NASA ADS] [CrossRef] [Google Scholar]
- Carroll, S. M., De Felice, A., & Trodden, M. 2005, Phys. Rev. D, 71, 023525 [Google Scholar]
- Casey, C. M., Akins, H. B., Shuntov, M., et al. 2024, ApJ, 965, 98 [NASA ADS] [CrossRef] [Google Scholar]
- Castellano, M., Fontana, A., Treu, T., et al. 2022, ApJ, 938, L15 [NASA ADS] [CrossRef] [Google Scholar]
- Chakraborty, A., Choudhury, T. R., Sen, A. A., & Mukherjee, P. 2025, arXiv e-prints [arXiv:2509.02431] [Google Scholar]
- Chaudhary, H., Capozziello, S., Sharma, V. K., & Mustafa, G. 2025, ApJ, 992, 194 [Google Scholar]
- Chaudhary, H., Capozziello, S., Praharaj, S., Pacif, S. K. J., & Mustafa, G. 2026, J. High Energy Astrophys., 50, 100507 [Google Scholar]
- Chevallier, M., & Polarski, D. 2001, Int. J. Mod. Phys. D, 10, 213 [Google Scholar]
- Correa, C. A., Wyithe, J. S. B., Schaye, J., & Duffy, A. R. 2015, MNRAS, 450, 1514 [NASA ADS] [CrossRef] [Google Scholar]
- Danielsson, U. H., & Van Riet, T. 2018, Int. J. Mod. Phys. D, 27, 1830007 [Google Scholar]
- Dayal, P. 2024, A&A, 690, A182 [NASA ADS] [CrossRef] [EDP Sciences] [Google Scholar]
- Dayal, P., & Maiolino, R. 2026, A&A, 706, A72 [NASA ADS] [CrossRef] [EDP Sciences] [Google Scholar]
- Dayal, P., Rossi, E. M., Shiralilou, B., et al. 2019, MNRAS, 486, 2336 [Google Scholar]
- Dekel, A., Sarkar, K. C., Birnboim, Y., Mandelker, N., & Li, Z. 2023, MNRAS, 523, 3201 [NASA ADS] [CrossRef] [Google Scholar]
- Demirtas, M., Kim, M., McAllister, L., Moritz, J., & Rios-Tascon, A. 2021, JHEP, 12, 136 [Google Scholar]
- Demirtas, M., Kim, M., McAllister, L., Moritz, J., & Rios-Tascon, A. 2022, Phys. Rev. Lett., 128, 011602 [Google Scholar]
- Di Valentino, E., Mukherjee, A., & Sen, A. A. 2021, Entropy, 23, 404 [Google Scholar]
- Dodelson, S. 2003, Modern Cosmology (Academic Press, Elsevier Science) [Google Scholar]
- Donnan, C. T., McLeod, D. J., Dunlop, J. S., et al. 2022, MNRAS, 518, 6011 [NASA ADS] [CrossRef] [Google Scholar]
- Donnan, C. T., McLeod, D. J., McLure, R. J., et al. 2023, MNRAS, 520, 4554 [NASA ADS] [CrossRef] [Google Scholar]
- Dutta, K., Ruchika, Roy, A., Sen, A. A., & Sheikh-Jabbari, M. M. 2020, Gen. Rel. Grav., 52, 15 [Google Scholar]
- Fan, X., Bañados, E., & Simcoe, R. A. 2023, ARA&A, 61, 373 [NASA ADS] [CrossRef] [Google Scholar]
- Ferrara, A. 2024, A&A, 684, A207 [NASA ADS] [CrossRef] [EDP Sciences] [Google Scholar]
- Finkelstein, S. L., Bagley, M. B., Arrabal Haro, P., et al. 2022, ApJ, 940, L55 [NASA ADS] [CrossRef] [Google Scholar]
- Finkelstein, S. L., Bagley, M. B., Ferguson, H. C., et al. 2023, ApJ, 946, L13 [NASA ADS] [CrossRef] [Google Scholar]
- Finkelstein, S. L., Leung, G. C. K., Bagley, M. B., et al. 2024, ApJ, 969, L2 [NASA ADS] [CrossRef] [Google Scholar]
- Furtak, L. J., Zitrin, A., Plat, A., et al. 2023, ApJ, 952, 142 [NASA ADS] [CrossRef] [Google Scholar]
- Furtak, L. J., Labbé, I., Zitrin, A., et al. 2024, Nature, 628, 57 [NASA ADS] [CrossRef] [Google Scholar]
- Gelli, V., Mason, C., & Hayward, C. C. 2024, ApJ, 975, 192 [NASA ADS] [CrossRef] [Google Scholar]
- Giallongo, E., Grazian, A., Fiore, F., et al. 2015, A&A, 578, A83 [NASA ADS] [CrossRef] [EDP Sciences] [Google Scholar]
- Giallongo, E., Grazian, A., Fiore, F., et al. 2019, ApJ, 884, 19 [Google Scholar]
- Giarè, W., Najafi, M., Pan, S., Di Valentino, E., & Firouzjaee, J. T. 2024, JCAP, 2024, 035 [CrossRef] [Google Scholar]
- Glikman, E., Djorgovski, S. G., Stern, D., et al. 2011, ApJ, 728, L26 [NASA ADS] [CrossRef] [Google Scholar]
- Graña, M., & Herráez, A. 2021, Universe, 7, 273 [Google Scholar]
- Grazian, A., Boutsia, K., Giallongo, E., et al. 2023, ApJ, 955, 60 [NASA ADS] [CrossRef] [Google Scholar]
- Greene, J. E., Labbe, I., Goulding, A. D., et al. 2024, ApJ, 964, 39 [CrossRef] [Google Scholar]
- Harikane, Y., Ouchi, M., Oguri, M., et al. 2023a, ApJS, 265, 5 [NASA ADS] [CrossRef] [Google Scholar]
- Harikane, Y., Zhang, Y., Nakajima, K., et al. 2023b, ApJ, 959, 39 [NASA ADS] [CrossRef] [Google Scholar]
- Inayoshi, K., & Ichikawa, K. 2024, Birth of Rapidly Spinning, Overmassive Black Holes in the Early Universe [Google Scholar]
- Juodžbalis, I., Maiolino, R., Baker, W. M., et al. 2024, Nature, 636, 594 [CrossRef] [Google Scholar]
- Juodžbalis, I., Maiolino, R., Baker, W. M., et al. 2025, arXiv e-prints [arXiv:2504.03551] [Google Scholar]
- Kocevski, D. D., Onoue, M., Inayoshi, K., et al. 2023, ApJ, 954, L4 [NASA ADS] [CrossRef] [Google Scholar]
- Kocevski, D. D., Finkelstein, S. L., Barro, G., et al. 2025, ApJ, 986, 126 [Google Scholar]
- Kokorev, V., Fujimoto, S., Labbe, I., et al. 2023, ApJ, 957, L7 [NASA ADS] [CrossRef] [Google Scholar]
- Kokorev, V., Caputi, K. I., Greene, J. E., et al. 2024, ApJ, 968, 38 [NASA ADS] [CrossRef] [Google Scholar]
- Kovács, O. E., Bogdán, Á., Natarajan, P., et al. 2024, ApJ, 965, L21 [CrossRef] [Google Scholar]
- Labbé, I., van Dokkum, P., Nelson, E., et al. 2023, Nature, 616, 266 [CrossRef] [Google Scholar]
- Labbe, I., Greene, J. E., Bezanson, R., et al. 2025, ApJ, 978, 92 [NASA ADS] [CrossRef] [Google Scholar]
- Lacey, C., & Cole, S. 1993, MNRAS, 262, 627 [NASA ADS] [CrossRef] [Google Scholar]
- LaChance, P., Croft, R. A. C., Di Matteo, T., et al. 2025, arXiv e-prints [arXiv:2505.20439] [Google Scholar]
- Lai, S., Onken, C. A., Wolf, C., Bian, F., & Fan, X. 2024, MNRAS, 531, 2245 [NASA ADS] [CrossRef] [Google Scholar]
- Latif, M. A., Whalen, D. J., Khochfar, S., Herrington, N. P., & Woods, T. E. 2022, Nature, 607, 48 [CrossRef] [Google Scholar]
- Linder, E. V. 2003, Phys. Rev. Lett., 90, 091301 [Google Scholar]
- Linder, E. V. 2006, Phys. Rev. D, 73, 063010 [Google Scholar]
- Linder, E. V. 2008a, Rep. Prog. Phys., 71, 056901 [Google Scholar]
- Linder, E. V. 2008b, Gen. Rel. Grav., 40, 329 [NASA ADS] [CrossRef] [Google Scholar]
- Liu, Y., Gao, L., Bose, S., et al. 2024, MNRAS, 527, 11740 [Google Scholar]
- Lodha, K., Calderon, R., Matthewson, W. L., et al. 2025a, Phys. Rev. D, 112, 083511 [Google Scholar]
- Lodha, K., Shafieloo, A., Calderon, R., et al. 2025b, Phys. Rev. D, 111, 023532 [Google Scholar]
- Louis, T., La Posta, A., Atkins, Z., et al. 2025, JCAP, 11, 062 [Google Scholar]
- Ludwick, K. J. 2017, Mod. Phys. Lett. A, 32, 1730025 [Google Scholar]
- Lupi, A., Quadri, G., Volonteri, M., Colpi, M., & Regan, J. A. 2024, A&A, 686, A256 [NASA ADS] [CrossRef] [EDP Sciences] [Google Scholar]
- Luu, H. N., Qiu, Y.-C., & Tye, S.-H. H. 2025, Phys. Rev. D, 112, 023524 [Google Scholar]
- Madau, P., & Rees, M. J. 2001, ApJ, 551, L27 [Google Scholar]
- Madau, P., Haardt, F., & Dotti, M. 2014, ApJ, 784, L38 [NASA ADS] [CrossRef] [Google Scholar]
- Maiolino, R., Scholtz, J., Curtis-Lake, E., et al. 2024a, A&A, 691, A145 [NASA ADS] [CrossRef] [EDP Sciences] [Google Scholar]
- Maiolino, R., Scholtz, J., Witstok, J., et al. 2024b, Nature, 627, 59 [NASA ADS] [CrossRef] [Google Scholar]
- Maldacena, J. M. 1998, Adv. Theor. Math. Phys., 2, 231 [Google Scholar]
- Malekjani, M., Conville, R. M., Colgáin, E. O., Pourojaghi, S., & Sheikh-Jabbari, M. M. 2024, Eur. Phys. J. C, 84, 317 [NASA ADS] [CrossRef] [Google Scholar]
- Mason, C. A., Trenti, M., & Treu, T. 2015, ApJ, 813, 21 [NASA ADS] [CrossRef] [Google Scholar]
- Matthee, J., Naidu, R. P., Brammer, G., et al. 2024, ApJ, 963, 129 [NASA ADS] [CrossRef] [Google Scholar]
- McClymont, W., Tacchella, S., Ji, X., et al. 2026, MNRAS, 545, staf2092 [Google Scholar]
- McLeod, D. J., Donnan, C. T., McLure, R. J., et al. 2023, MNRAS, 527, 5004 [NASA ADS] [CrossRef] [Google Scholar]
- Menci, N., Castellano, M., Santini, P., et al. 2022, ApJ, 938, L5 [NASA ADS] [CrossRef] [Google Scholar]
- Menci, N., Adil, S. A., Mukhopadhyay, U., Sen, A. A., & Vagnozzi, S. 2024a, JCAP, 2024, 072 [CrossRef] [Google Scholar]
- Menci, N., Sen, A. A., & Castellano, M. 2024b, ApJ, 976, 227 [Google Scholar]
- Mukherjee, P., Kumar, D., & Sen, A. A. 2025, arXiv e-prints [arXiv:2501.18335] [Google Scholar]
- Murai, K., & Takahashi, F. 2025, Phys. Rev. D, 112, 103501 [Google Scholar]
- Neistein, E., Van Den Bosch, F. C., & Dekel, A. 2006, MNRAS, 372, 933 [NASA ADS] [CrossRef] [Google Scholar]
- Ni, Y., Di Matteo, T., Bird, S., et al. 2022, MNRAS, 513, 670 [NASA ADS] [CrossRef] [Google Scholar]
- Nojiri, S., Odintsov, S. D., & Tsujikawa, S. 2005, Phys. Rev. D, 71, 063004 [CrossRef] [Google Scholar]
- Oikonomou, V. K., & Giannakoudi, I. 2022, Int. J. Mod. Phys. D, 31, 2250075 [Google Scholar]
- Padmanabhan, T. 2002, Theoretical Astrophysics – Volume 3, Galaxies and Cosmology (Cambridge: Cambridge University Press), 3 [Google Scholar]
- Palti, E. 2019, Fortschr. Phys., 67, 1900037 [Google Scholar]
- Peacock, J. A. 1999, Cosmological Physics (Cambridge: Cambridge University Press) [Google Scholar]
- Peebles, P. J. E., & Ratra, B. 1988, ApJ, 325, L17 [NASA ADS] [CrossRef] [Google Scholar]
- Pérez-González, P. G., Costantin, L., Langeroodi, D., et al. 2023, ApJ, 951, L1 [CrossRef] [Google Scholar]
- Pérez-González, P. G., Östlin, G., Costantin, L., et al. 2025, The Rise of the Galactic Empire: Luminosity Functions at z ∼ 17 and z ∼ 25 Estimated with the MIDIS+NGDEEP Ultra-Deep JWST/NIRCam Dataset [Google Scholar]
- Perkovic, D., & Stefancic, H. 2020, Eur. Phys. J. C, 80, 629 [Google Scholar]
- Perlmutter, S., Aldering, G., Goldhaber, G., et al. 1999, ApJ, 517, 565 [Google Scholar]
- Porras-Valverde, A. J., Ricarte, A., Natarajan, P., et al. 2025, arXiv e-prints [arXiv:2504.11566] [Google Scholar]
- Poulin, V., Boddy, K. K., Bird, S., & Kamionkowski, M. 2018, Phys. Rev. D, 97, 123504 [Google Scholar]
- Quadri, G., Trinca, A., Lupi, A., Colpi, M., & Volonteri, M. 2025, arXiv e-prints [arXiv:2505.05556] [Google Scholar]
- Ratra, B., & Peebles, P. J. E. 1988, Phys. Rev. D, 37, 3406 [Google Scholar]
- Riess, A. G., Filippenko, A. V., Challis, P., et al. 1998, AJ, 116, 1009 [Google Scholar]
- Robertson, B., Johnson, B. D., Tacchella, S., et al. 2024, ApJ, 970, 31 [NASA ADS] [CrossRef] [Google Scholar]
- Rubin, D., Aldering, G., Betoule, M., et al. 2025, Union Through UNITY: Cosmology with 2000 SNe Using a Unified Bayesian Framework [Google Scholar]
- Ruchika, Adil, S. A., Dutta, K., Mukherjee, A., & Sen, A. A. 2023, Phys. Dark Universe, 40, 101199 [Google Scholar]
- Sánchez, B. O., Brout, D., Vincenzi, M., et al. 2024, ApJ, 975, 5 [Google Scholar]
- Schauer, A. T. P., Regan, J., Glover, S. C. O., & Klessen, R. S. 2017, MNRAS, 471, 4878 [NASA ADS] [CrossRef] [Google Scholar]
- Scherrer, R. J. 2015, Phys. Rev. D, 92, 043001 [Google Scholar]
- Scholtz, J., Maiolino, R., D’Eugenio, F., et al. 2025, A&A, 697, A175 [NASA ADS] [CrossRef] [EDP Sciences] [Google Scholar]
- Scolnic, D., Brout, D., Carr, A., et al. 2022, ApJ, 938, 113 [NASA ADS] [CrossRef] [Google Scholar]
- Sen, A. A., Adil, S. A., & Sen, S. 2022, MNRAS, 518, 1098 [Google Scholar]
- Shen, X., Hopkins, P. F., Faucher-Giguère, C.-A., et al. 2020, MNRAS, 495, 3252 [Google Scholar]
- Shen, X., Vogelsberger, M., Boylan-Kolchin, M., Tacchella, S., & Kannan, R. 2023, MNRAS, 525, 3254 [NASA ADS] [CrossRef] [Google Scholar]
- Sheth, R. K., & Tormen, G. 1999, MNRAS, 308, 119 [Google Scholar]
- Somerville, R. S., Yung, L. Y. A., Lancaster, L., et al. 2025, MNRAS, 544, 3774 [Google Scholar]
- Sun, G., Faucher-Giguère, C.-A., Hayward, C. C., et al. 2023, ApJ, 955, L35 [CrossRef] [Google Scholar]
- Svrcek, P. 2006, arXiv e-prints [arXiv:hep-th/0607086] [Google Scholar]
- Taylor, A. J., Finkelstein, S. L., Kocevski, D. D., et al. 2024, arXiv e-prints [arXiv:2409.06772] [Google Scholar]
- Trinca, A., Schneider, R., Valiante, R., et al. 2024a, MNRAS, 529, 3563 [NASA ADS] [CrossRef] [Google Scholar]
- Trinca, A., Valiante, R., Schneider, R., et al. 2024b, arXiv e-prints [arXiv:2412.14248] [Google Scholar]
- Trivedi, O. 2024, Symmetry, 16, 298 [Google Scholar]
- Umeda, H., Inayoshi, K., Harikane, Y., & Murase, K. 2025, arXiv e-prints [arXiv:2512.04208] [Google Scholar]
- Vafa, C. 2005, arXiv e-prints [arXiv:hep-th/0509212] [Google Scholar]
- Vikman, A. 2005, Phys. Rev. D, 71, 023515 [NASA ADS] [CrossRef] [Google Scholar]
- Vincenzi, M., Brout, D., Armstrong, P., et al. 2024, ApJ, 975, 86 [NASA ADS] [CrossRef] [Google Scholar]
- Visinelli, L., Vagnozzi, S., & Danielsson, U. 2019, Symmetry, 11, 1035 [NASA ADS] [CrossRef] [Google Scholar]
- Volonteri, M., Haardt, F., & Madau, P. 2003, ApJ, 582, 559 [Google Scholar]
- Volonteri, M., Silk, J., & Dubus, G. 2015, ApJ, 804, 148 [Google Scholar]
- Volonteri, M., Habouzit, M., & Colpi, M. 2021, Nat. Rev. Phys., 3, 732 [NASA ADS] [CrossRef] [Google Scholar]
- Volonteri, M., Trebitsch, M., Dubois, Y., et al. 2024, arXiv e-prints [arXiv:2408.12854] [Google Scholar]
- Wang, H., Peng, Z.-Y., & Piao, Y.-S. 2025, Phys. Rev. D, 111, L061306 [Google Scholar]
- Wechsler, R. H., Bullock, J. S., Primack, J. R., Kravtsov, A. V., & Dekel, A. 2002, ApJ, 568, 52 [NASA ADS] [CrossRef] [Google Scholar]
- Weibel, A., Oesch, P. A., Barrufet, L., et al. 2024, MNRAS, 533, 1808 [NASA ADS] [CrossRef] [Google Scholar]
- Wetterich, C. 1995, A&A, 301, 321 [NASA ADS] [Google Scholar]
- Whitler, L., Endsley, R., Stark, D. P., et al. 2022, MNRAS, 519, 157 [CrossRef] [Google Scholar]
- Xiao, M., Oesch, P., Elbaz, D., et al. 2024, Accelerated Formation of Ultra-Massive Galaxies in the First Billion Years [Google Scholar]
- Yung, L. Y. A., Somerville, R. S., Finkelstein, S. L., Wilkins, S. M., & Gardner, J. P. 2023, MNRAS, 527, 5929 [NASA ADS] [CrossRef] [Google Scholar]
- Zhu, Q., Li, Y., Li, Y., et al. 2022, MNRAS, 514, 5583 [NASA ADS] [CrossRef] [Google Scholar]
All Figures
|
Fig. 1. 2D confidence contour in w0 − wa plane for our model using CMB+DESI+DES data combination. The dash-dotted line is a phantom line. Above this line, the allowed region is always non-phantom, whereas below it the allowed region is early phantom and late non-phantom. Dots represent different MCMC realisations. The colour-code shows the value of ΩΛ that allows for consistency with the above cosmological probes. |
| In the text | |
|
Fig. 2. Top left: Based on our MCMC procedure for the selection of (w0-wa, ΩΛ) combinations consistent (at 2-σ level) with the considered cosmological probes, we show as the average ΩΛ as a function of (w0-wa) coloured contours. The colour-code is shown by the bar in the bottom right of the figure. Top right: For combinations (w0 ≥ −1, wa ≥ 0) considered here, we show the values of Ωm and σ8 consistent (at a 2-σ level) with the considered cosmological probes. The colour-code refers to the average values of ΩΛ corresponding to each combination, as shown by the bottom bar. Bottom left: Probability distribution of ΩΛ resulting from our MCMC procedure for the combinations (w0 ≥ −1, wa ≥ 0) considered here. |
| In the text | |
|
Fig. 3. High-redshift UV luminosity functions of galaxies for our fiducial combination of (w0, wa) in the different redshift bins shown by the labels. The colour-code corresponds to the different values of ΩΛ as shown in the top bar, while the dashed line marks the results for the standard ΛCDM cosmology. We compared with measurements from Finkelstein et al. (2023, diamonds), Donnan et al. (2023, stars), McLeod et al. (2023, upward triangle), Harikane et al. (2023a, open square), Adams et al. (2024, pentagon), Bouwens et al. (2022, circle), and Robertson et al. (2024, downward triangle). |
| In the text | |
|
Fig. 4. Maximal growth of BHs from Mseed = 102 M⊙ at zseed = 25 is shown for the different values of ΩΛ shown in the colour bar for our fiducial combination w0 = −0.98, wa = 0.08; the dashed line marks the result for the standard ΛCDM cosmology. To maximise the BH mass, we assumed continuous Eddington-limited accretion. We compared these models to BHs measured by Bogdán et al. (2024, solid square), Furtak et al. (2024, cross), Greene et al. (2024, empty pentagons), Juodžbalis et al. (2024, upward triangle), Harikane et al. (2023a, filled diamonds), Maiolino et al. (2024a, downward triangles), Maiolino et al. (2024b, solid circle), and Kocevski et al. (2023, solid pentagon). |
| In the text | |
|
Fig. 5. Bolometric luminosity function of AGNs under the assumption of continuous accretion at the Eddington rate shown for the different values of ΩΛ in the colour bar for our fiducial combination w0 = −0.98, wa = 0.08; the dashed line marks the result for the standard ΛCDM cosmology. We compared with the measurements of Akins et al. (2024), which are based on JWST observations (red circles), derived under the assumption that the emission of LRDs is entirely contributed by AGNs, and with those of Harikane et al. (2023a, orange pentagon). For comparison, we also show the pre-JWST measurements by Shen et al. (2020) as a shaded area, by Glikman et al. (2011, square), Grazian et al. (2023, diamonds), and the X-ray measurement through Chandra COSMOS data by Barlow-Hall & Aird (2025, triangles) and Barlow-Hall et al. (2023, star). |
| In the text | |
|
Fig. 6. Stellar mass function of galaxies for the different values of ΩΛ shown in the colour bar for our fiducial combination w0 = −0.98, wa = 0.08; the dashed line marks the result for the standard ΛCDM cosmology. We compared the JWST measurements by Weibel et al. (2024) with the estimate by Akins et al. (2024, shaded area), which considered the additional contribution by LRDs under the assumption that the emission was entirely contributed by stars. |
| In the text | |
Current usage metrics show cumulative count of Article Views (full-text article views including HTML views, PDF and ePub downloads, according to the available data) and Abstracts Views on Vision4Press platform.
Data correspond to usage on the plateform after 2015. The current usage metrics is available 48-96 hours after online publication and is updated daily on week days.
Initial download of the metrics may take a while.