| Issue |
A&A
Volume 703, November 2025
|
|
|---|---|---|
| Article Number | A292 | |
| Number of page(s) | 20 | |
| Section | Planets, planetary systems, and small bodies | |
| DOI | https://doi.org/10.1051/0004-6361/202555204 | |
| Published online | 26 November 2025 | |
Noble gas enrichment in the Jovian atmosphere via disk photoevaporation
1
Laboratoire Lagrange, Centre National de la Recherche Scientifique,
Observatoire de la Côte d’Azur,
06304
Nice,
France
2
Earth-Life Science Institute, Institute of Science Tokyo (previously Tokyo Institute of Technology),
Meguro-ku,
152-8550
Tokyo,
Japan
3
Tsung-Dao Lee Institute, Shanghai Jiao Tong University,
1 Lisuo Road,
Shanghai
201210,
China
4
Department of Physics, Kurume University,
67 Asahimachi,
Kurume,
830-0011
Fukuoka,
Japan
5
Faculty of Aerospace Engineering, Delft University of Technology,
Delft,
The Netherlands
6
Center for Space and Habitability, University of Bern,
Bern,
Switzerland
★ Corresponding author: This email address is being protected from spambots. You need JavaScript enabled to view it.
Received:
18
April
2025
Accepted:
26
August
2025
Abstract
Context. The Galileo probe has revealed that noble gas abundances (Ar, Kr, Xe) in the Jovian atmosphere are two to three times higher than the solar value. As the composition of the Jovian atmosphere was previously assumed be the same as the solar value, the origin of this heightened proportion remains a mystery. Prior studies have suggested that disk photoevaporation could explain the enrichment; however, their methods did not incorporate the effects of sublimation and condensation for noble gases.
Aims. We aim to explain the enrichment of noble gases in the Jovian atmosphere, considering the sublimation and recondensation of each noble gas, along with disk photoevaporation and radial dust transport.
Methods. We solved a one-dimensional diffusion equation for the disk gas from the infall stage, incorporating internal and external photoevaporation. We also solved the advection and diffusion equations for the dust and noble gases. We focused on models with the capacity to reproduce the global characteristics of the early solar system, namely, the disappearance of the disk after 4–6 Myr and the formation of planetesimals at two locations.
Results. When noble gases are trapped only on the surface of amorphous ice, it is believed that argon, krypton, and xenon are released from cold dust grains in the protosolar disk at temperatures between 19 and 35 K. Our models generally lead to a very inefficient trapping and near-solar abundances in Jupiter, incompatible with the constraints. However, recent laboratory experiments using amorphous ice trapping, the noble gases inside yielded significantly higher desorption energies, resulting in the release of noble gases between 40 and 50 K. Finally, we find that the lower mass-loss rate attributed to disk photoevaporation is sufficient to reproduce the noble gas enrichment.
Key words: methods: miscellaneous / planets and satellites: atmospheres / planets and satellites: composition / protoplanetary disks / planets and satellites: individual: Jupiter
© The Authors 2025
 Open Access article, published by EDP Sciences, under the terms of the Creative Commons Attribution License (https://creativecommons.org/licenses/by/4.0), which permits unrestricted use, distribution, and reproduction in any medium, provided the original work is properly cited.
This article is published in open access under the Subscribe to Open model. This email address is being protected from spambots. You need JavaScript enabled to view it. to support open access publication.
1 Introduction
The Jovian atmosphere is formed by the accretion of solar nebula gas onto the Jovian core (e.g., Mizuno 1980; Bodenheimer & Pollack 1986; Pollack et al. 1996). Thus, the abundance of each element in the Jovian atmosphere should be the same as the solar value. However, about two decades ago, the Galileo probe revealed that noble gas abundances (i.e., of argon, krypton, and xenon) are two to four times higher than the solar (e.g., Mahaffy et al. 2000; Atreya et al. 2018; Guillot et al. 2023). Explaining this observation remains a challenging matter of debate.
One possible scenario is Jupiter formation in the cold disk region (Owen et al. 1999; Öberg & Wordsworth 2019; Bosman et al. 2019). In this scenario, Jupiter is considered to form outside the ice lines of the noble gases and N2, capturing these elements as solids and vaporizing them inside the atmosphere and interior of the planet. Since noble gases condense at low temperatures (T ~ 20–40 K), Jupiter would thus accrete material rich in N2 but also planetesimals with a composition that may be close to those of comets. However, Mahaffy et al. (2000) showed that the isotopic composition of Xe in the Jovian atmosphere is solar, while the isotopic composition of Xe of comet 67P C-G is non-solar (Marty et al. 2017). These observational results exclude the possibility of (1) an erosion of noble gases from the Jovian core if it is composed of comet-like materials and (2) a late delivery of planetesimals (see also Howard et al. 2023). They also require a very large migration of Jupiter over 20–40 au, which seems to be difficult to combine with other valid constraints on the Solar System (Morbidelli et al. 2024).
Another proposed scenario involves the photoevaporation of the disk gas (e.g., Guillot & Hueso 2006; Morbidelli et al. 2024). When dust settles vertically and drifts inward faster than the gas, noble gases frozen onto the dust surface also settle and drift faster than the gas. This process leads to an enrichment of noble species inside of their ice lines (when they are released from the grains) and a depletion outside of them (e.g., Bitsch & Mah 2023). This enrichment is only temporary, however, because the gas that is rich in noble gases in the inner disk is also accreted onto the central star. Guillot & Hueso (2006) showed that photoevaporation occurs preferentially in regions that are noble gas-poor, so the accretion of gas by forming giant planets that occurs simultaneously with the disappearance of the circumstellar gas disk can result in giant planet envelopes that end up enriched by noble gases. They showed that for high enough photoevaporation fluxes, it is possible to account for the measured enrichments in Jupiter’s atmosphere. While Guillot & Hueso (2006) focused mainly on the vertical settling of the grains, Monga & Desch (2015) then showed that their radial drift was a key mechanism that needed to be taken into account.
However, these works were presented as proof-of-concept studies, rather than detailed calculations. The condensation and sublimation of the noble gases were treated in the same way for all species. The vertical temperature inversion in the disk was assumed to prevent an upward transport of noble gases into the photoevaporating disk atmosphere. Modern constraints on the structure and evolution of the protosolar disk were not incorporated. For example, the protosolar gas disk dispersal timescale is now estimated to be 4–6 Myr in age, based on chondrite accretion ages (e.g., Villeneuve et al. 2009; Sugiura & Fujiya 2014) and observations of protoplanetary disks (e.g., Haisch et al. 2001; Briceño et al. 2005). In addition, isotopic anomalies in refractory elements reveal a dichotomy between non-carbonaceous and carbonaceous chondrites (e.g., Budde et al. 2016; Nanne et al. 2019), as well as among iron meteorites (e.g., Kruijer et al. 2017). This dichotomy, as described in Morbidelli et al. (2022), can be explained by the formation of planetesimals in two spatially separated regions of the disk.
In this study, we aim to construct a self-consistent protosolar disk model that can replicate the noble gas enrichment in the Jovian atmosphere. We account for recent experimental results on the adsorption and desorption of noble gases on dust particles. We calculate the time evolution of the surface densities of a back-ground gas disk and trace abundances of noble gas species in a disk undergoing photoevaporation. We optimize the disk parameter set to obtain a disk dispersal between 4 and 6 Myr. Our goal is to check the parameters that allow for both the formation of planetesimals at two locations and the enrichment of Jupiter’s envelope to match the Galileo probe constraints.
In Sect. 2, we describe our disk model. In Sect. 3, we show the calculation results with the desorption energies of Smith et al. (2016, hereafter, SMK2016). The noble gas enrichment cannot be reproduced in this case, except for the lower stellar luminosity case. In Sect. 4, we show the calculation results with the desorption energies of Ligterink et al. (2024b, here-after, L+2024), which can reproduce the noble gas enrichment. In Sect. 5, we discuss the more realistic and preferable desorption model of noble gases. We present our conclusions in Sect. 6.
2 Methods
2.1 Disk model
2.1.1 Viscous evolution of gas disk
We used the Diskbuild protoplanetary disk model (Morbidelli et al. 2022; Marschall & Morbidelli 2023) to solve the one-dimensional (1D) advection and diffusion equations for disk gas, Σg,
 (1)
(1)
where S g is a source function of the gas from infall, and  is the gas radial velocity given by
 (2)
(2)
Here, v is the gas viscosity defined by  , where Hg is the gas scale height and ΩK is a Keplerian frequency. Then,
  is the loss rate in the gas surface density by photoevaporation and is given by
 (3)
(3)
where  is the mass loss due to internal photoevaporation (IPE) due to X-ray from a central star and
  is the mass loss due to external photoevaporation (EPE) due to far-ultraviolet (FUV) radiation from nearby stars.
The Diskbuild protoplanetary disk model adopts an “inside-out” formation scenario. While classical models of gas disk formation assumed that the centrifugal radius grows over time (e.g., Shu 1977), recent magneto-hydrodynamic simulations have shown that magnetic braking can efficiently remove angular momentum from infalling material, resulting in a much smaller centrifugal radius (e.g., Lee et al. 2021). As a consequence, most of the infalling material is deposited in the inner regions of the disk during the early stages of its evolution. The centrifugal radius, Rc, is thus given by
 (4)
(4)
where M*, is the stellar mass. We considered the possibility that the mass accretion rate of the infalling gas, Ṁg,infall, decays over time and is given by
 (5)
(5)
where tinfall is the timescale of gas infall. We set tinfall = 105 years, corresponding to the infall timescale order in previous theoretical studies (e.g., Hueso & Guillot 2005; Schoonenberg et al. 2018). We set the initial stellar mass as M*(0) = 0.5 M⊙. The mass accretion rate of the infalling gas for each bin is given by
![Mathematical equation: ${\dot M_{{\rm{g,infall}}}}\left( r \right) = \left[ {{{\left( {1 - \sqrt {{{{r_1}} \over {{R_{\rm{c}}}\left( t \right)}}} } \right)}^{0.5}} - {{\left( {1 - \sqrt {{{{r_{\rm{u}}}} \over {{R_{\rm{c}}}\left( t \right)}}} } \right)}^{0.5}}} \right]{\dot M_{{\rm{g,infall}}}}\left( t \right),$](/articles/aa/full_html/2025/11/aa55204-25/aa55204-25-eq11.png) (6)
(6)
where ru and r1 are the orbital radii of the upper and lower boundaries for a given bin.
As Lee et al. (2021) showed that the gas turbulence increases in the infall stage, we adopted a time-dependent turbulence parameter α given by
 (7)
(7)
where α0 and αend are the turbulent strength in t = 0 and t = ∞. We set αend = 5 × 10⁻⁴ and used α0 as a parameter.
2.1.2 Temperature profile
We calculated the midplane temperature, T, by estimating the energy balance for each disk ring. The change in temperature, δT, at each time step, δt, is estimated to be
 (8)
(8)
where Q+ and Q− are the energies that each disk ring obtains or loses per unit of time, δFT is the difference in the energy flux between the outer and inner boundaries of the disk ring, and DT is the total heat capacity for the disk ring given by DT = cυ2πrδrΣg. Here, cυ is the heat capacity of gas per unit mass estimated to be cυ = kB/[µmH(γ − 1)], where kB is the Boltzman constant, µ is the mean molecule weight of the disk gas (µ ≃ 2.34), mH is the hydrogen atom mass, and γ = 1.4 is the adiabatic index.
The heating source of the disk ring, Q+, is composed of a release of the gravitational energy of the infall materials, Qinfall, viscous heating, Qvis, and irradiation from the central star, Qirr. The energy released by the infall is given by
 (9)
(9)
The energy released by viscous heating for each disk ring is given by
 (10)
(10)
where δr is the width of the disk ring. The energy obtained by irradiation is given by (Chiang & Goldreich 1997):
 (11)
(11)
where Hs is the height of the photosphere surface, and L* is the stellar luminosity. The energy loss from the upper and lower surfaces of the disk ring, Q−, is given by
 (12)
(12)
where σB is the Stephan-Boltzmann constant and Ts is the temperature on the surface of the photosphere of the disk. The relation between Ts and the temperature in the midplane, T, is given by
 (13)
(13)
where κR is the Rossland mean opacity of the disk. We adopted κR estimated by Bell & Lin (1994).
The contribution corresponding to the energy flux through the disk ring, δFT is calculated by δFT = FT(ru) − FT(rl), where FT(r) is the energy flux given by
 (14)
(14)
where ρg is the local gas density in the midplane given by  .
.
2.1.3 Photoevaporation
For the calculation of  , we used the approximation of the mass loss profile due to X-ray irradiation built by Picogna et al. (2021), expressed as
 (15)
(15)
where
 (16)
(16)
Here, a = −0.6344, b = 6.3587, c = −26.1445, d = 56.4477, e = −67.7403, f = −43.9212, and 𝑔 = −13.2316. The integrated mass-loss rate depending on the stellar X-ray irradiation is given by (Ercolano et al. 2021):
![Mathematical equation: ${\log _{10}}\left[ {{{{{\dot M}_{\rm{X}}}\left( {{L_{\rm{X}}}} \right)} \over {{M_ \odot }\,{\rm{y}}{{\rm{r}}^{ - 1}}}}} \right] = {A_{\rm{L}}}\exp \left[ {{{{{\left( {\ln \left( {{{\log }_{10}}\left( {{L_{\rm{X}}}} \right)} \right) - {B_{\rm{L}}}} \right)}^2}} \over {{C_{\rm{L}}}}}} \right] + {D_{\rm{L}}},$](/articles/aa/full_html/2025/11/aa55204-25/aa55204-25-eq24.png) (17)
(17)
with AL = −1.947 × 10¹⁷, BL = −1.572 × 10⁻⁴, CL = −0.2866, and DL = −6.694. We set the stellar X-ray luminosity as 1030 erg s−1 based on an X-ray luminosity versus mass correlation estimated from observations of the Taurus Molecular Cloud (Güdel et al. 2007). We introduced a factor fIPE for the reduction of mass-loss rate due to internal photoevaporation since Güdel et al. (2007) showed a large dispersion of X-ray luminosity and currently, Sellek et al. (2024) showed that the estimation of the mass-loss rate by Ercolano et al. (2021) might be overestimated by an order of magnitude. We tested the cases with fIPE = 0.1 and 0.25.
We used the FRIEDv2 grid developed by Haworth et al. (2023) to incorporate external photoevaporation. This grid gives the mass loss rate of the disk gas Ṁg,EPE(FFUV, M*, R, Σg,disk) for a given FUV field, stellar mass, radius, and gas surface density at the radius. This grid also has parameters for the ratio of polycyclic aromatic hydrocarbons (PAHs) to dust (fPAH). The higher abundance of PAHs can increase the mass-loss rate due to photoelectric heating (Tielens 2008). We set fPAH = 1, corresponding to the PAH-to-dust ratio similar to ISM, 2.6 × 10⁻² (Wolfire et al. 2003; Haworth et al. 2023). We also considered the appearance of grain growth on the outer disk. Haworth et al. (2023) showed that the depletion of small dust can reduce the optical depth to FUV radiation and increase the mass-loss rate. We note that their dust temperature model does not consider the dependence of heating and cooling rates on dust growth. For the investigation on the IPE, Nakatani et al. (2018a) showed that dust growth also reduces the efficiency of photoelectric heating by FUV radiation and results in a lower mass-loss rate. On the contrary, Haworth et al. (2023) considered the reduction in the opacity for FUV of the dust-depleted disk wind due to dust growth. They showed that this effect outweighs the reduction in photoelectric heating.
The EPE mainly removes the gas close to the gas disk edge, rdisk. We chose rmax, the radius showing the maximum mass-loss rate from the FRIED grid. Then, we converted Ṁg,EPE to  , following Coleman et al. (2024):
 (18)
(18)
where Gsm is a smoothing function given by
![Mathematical equation: ${G_{{\rm{sm}}}} = 1 - {\left[ {1 + {{\left( {{r \over {{r_{\max }}}}} \right)}^{20}}} \right]^{ - 1}},$](/articles/aa/full_html/2025/11/aa55204-25/aa55204-25-eq27.png) (19)
(19)
and Asm is the smoothing area given by
 (20)
(20)
We defined the disk edge, rdisk, as the outermost radius where the gas surface density exceeds the base value, 10−5 g/cm2.
2.2 Time evolution of dust and noble gases
2.2.1 Orbital motion of dust and noble gases
We also used Diskbuild code to solve the 1D advection and diffusion equations of the dust surface densities given by
![Mathematical equation: ${{\partial {\Sigma _{\rm{d}}}} \over {\partial t}} = {1 \over r}{\partial \over {\partial r}}\left[ {r{\Sigma _d}\upsilon _r^d - rD{\Sigma _{\rm{g}}}{\partial \over {\partial r}}\left( {{{{\Sigma _{\rm{d}}}} \over {{\Sigma _{\rm{g}}}}}} \right)} \right] + {S_{\rm{d}}} - {\dot \Sigma _{{\rm{d,ent}}}},$](/articles/aa/full_html/2025/11/aa55204-25/aa55204-25-eq29.png) (21)
(21)
where Sd is the dust source function and  is the dust removal due to the photoevaporative wind. D is the diffusion coefficient of trace species, which is the material in the disk except for hydrogen gas such as dust and noble gas, given by D = vSc, where Sc is the Schmidt number of the dust. When Sc = 1, the diffusivity of trace species is similar to that of the hydrogen gas. In contrast, Carballido et al. (2005) suggested that the diffusivity of any non-background species in the MRI-driven disk is weaker than that of the background gas, and Sc ≲ 0.1. Zhu et al. (2015) also showed that Sc < 1.0 for solid particles in the region dominated by ambipolar diffusion. These simulations suggest a lower diffusivity of trace species, especially for solid particles. Thus, we set Sc = 0.1 for all trace species and tested the case with Sc = 1.0 for species not trapped in the solids. However, MHD simulation including the Hall effect showed that the diffusivity of small solid particles (St ≲ 10−3) is high (Hu & Bai 2021). In this work, we ignored this effect.
The radial velocity of the dust,  , is given by
 (22)
(22)
where  is the azimuthal velocity of the gas and St is the Stokes number of dust. When dust whose size is sdust follows the Epstein law, the Stokes number is written as1
 (23)
(23)
where ρbulk is the bulk density of dust, and we set the bulk density ρbulk = 2g/cm3. We assumed that the main components of the dust are H2O ices, silicates, and more refractory components (see also Morbidelli et al. 2022). When the dust materials sublimate, the velocity becomes similar to that of the gas. We set the desorption temperatures for H2O ice (Tice), silicate (Tsil) and the refractory component (Tref) to be Tice = 170 K, Tsil = 1000 K, and Tref = 1400 K.
We calculated the surface density of noble gas species similarly to that of dust as described above. We set the initial element ratio of noble gases based on the solar value (Asplund et al. 2009), as shown in Table 1. The transition between the gas phase and the freezing onto the dust of noble gases is described in Section 2.2.4.
2.2.2 Dust growth
The dust grows on a timescale 1/(Σd/Σg)ΩK. However, the dust size is limited by collisional fragmentation or radial drift of dust.
The maximum Stokes number limited by fragmentation is estimated to be (Birnstiel et al. 2012; Drążkowska & Alibert 2017) as the maximum value between
 (24)
(24)
and
 (25)
(25)
where υfrag is the fragmentation threshold velocity of dust.
The fragmentation velocities for ice and silicate are still uncertain. Until a decade ago, icy dust was believed to be stickier than silicates, with estimated values of 10 m/s for ice and 1 m/s for silicates (e.g., Blum & Wurm 2000; Zsom et al. 2011; Wada et al. 2011; Gundlach et al. 2011). However, recent experiments have suggested the opposite: at low temperatures (below 150 K), the stickiness of the ice appears to be comparable to that of silicates (Gundlach et al. 2018; Musiolik & Wurm 2019; Schräpler et al. 2022). Gundlach et al. (2018) further suggested that the stickiness of the ice increases between 180 and 200 K compared to temperatures below 150 K. Marschall & Morbidelli (2023) thus applied the temperature-dependent fragmentation velocity for ice by fitting the data from Musiolik & Wurm (2019):
 (26)
(26)
where υ0 = 1 m/s, υC=16 m/s, and
 (27)
(27)
where ΓC = Γd0 = 0.25, β = 0.105, and T0 = 150 K. This fragmentation velocity is primarily affected by the temperature between 120 K and 170 K. Below 120 K, the fragmentation velocity for ice is approximately 1 m/s, similar to that for silicates.
In this study, we considered two models for fragmentation velocity of ice by introducing a switch, ƒvfrag. When ƒvfrag is off, the ice fragmentation velocity is set to 10 m/s throughout the entire region below 170 K, consistent with the earlier studies. When ƒvfrag is on, the ice fragmentation velocity varies with temperature, following Eqs. (26) and (27). Since ƒvfrag is based on variation in experimental data, the choice of this switch is independent of any conditions in our disk model.
On the other hand, we generally assumed that the fragmentation velocity for silicates is set to 1 m/s and is constant. Above 170 K, we assume that the icy mantle of the dust completely sublimates so that the fragmentation threshold velocity is equal to that of silicates.
When the local gas density is low, the dust drifts inwards before its growth. The maximum Stokes number of the dust limited by radial drift is given by
 (28)
(28)
We set the initial dust size as sdust = 1 µm, and incorporated dust growth on a timescale 1/(Σd/Σg)ΩK. We estimate the maximum Stokes number Stmax = min(Stfrag, Stddf, Stdrift) for each bin and time step, converting Stmax to the maximum dust size with Eq. (23).
Noble gas abundance of solar and Jovian atmosphere.
2.2.3 Dust and noble gas removal by photoevaporative wind
Guillot & Hueso (2006) showed that photoevaporation would lead to an efficient removal of all gases present in the region subject to mass loss: This is because the critical mass for fractionation is proportional to the mass loss flux divided by the local gravitational acceleration. Compared to a planetary atmosphere, the gravitational acceleration in a disk atmosphere is 3 to 7 orders of magnitude smaller, leading to typical values of the critical mass over 103−106 amu, and no fractionation below those values. Booth & Clarke (2021) and Burn et al. (2022) show that for macroscopic particles, drag forces have to be taken into account, and even small dust may be entrained by the outflow. Thus, preferential removal of hydrogen and helium occurs only if the evaporating regions are, on average, less heavy element rich than the rest of the disk (Guillot & Hueso 2006).
An important difference from the Guillot & Hueso (2006) study is that we assume that gases are mixed vertically efficiently. Guillot & Hueso assumed that the temperature inversion in the upper atmosphere of the disk would prevent convection and, therefore, the mixing of gases. Noble gases released by dust drifting to the disk midplane and to the inner regions of the disk would then remain in the central regions of the disk, protected from evaporation. Here, we notice that the vertical mixing timescale for gases is
 (29)
(29)
This is shorter than the disk lifetime and than the radial advection and diffusion timescales given by Eqs. (41) and (42). As a result, we assume that noble gases are removed by photoevaporation. Thus, our study is expected to lead to less efficient enrichment than that of Guillot & Hueso (2006).
We also incorporate dust removal when the dust size is small enough to be coupled with the photoevaporative wind, sent. The removal rate in dust surface density is given by
 (30)
(30)
where ƒent is the mass fraction of the dust whose size is smaller than sent. For a given size distribution n(s)ds ∝ sq ds, we obtained ƒent ~ (sent/smax)4+q. We assumed q = −3.5. We set smax equal to the value of sdust calculated in Section 2.2.2. This estimate is based on the assumption that the small dust particles diffuse efficiently through vertical mixing.
Our dust removal model follows Burn et al. (2022). sent, the maximum size of dust that can be removed by the external photoevaporative wind is estimated by equating the gravitational force from the central star to the drag force by the photoevaporative wind given by
 (31)
(31)
where υth is the thermal velocity of the gas in this wind, ρg is the local gas density, and υr,wind is radial velocity of the wind estimated to be (Sellek et al. 2020):
 (32)
(32)
where ℱ is a geometric factor given by  . Thus, the maximum removable dust size sent,EPE is estimated to be
 (33)
(33)
For sent for IPE, we adopt the limiting size derived by Booth & Clarke (2021). They calculated the vertical motion of the dust in the photoevaporative disk. They found that the maximum size sent,IPE is limited by the Stokes number of dust that can reach the ionization front. Thus, the maximum size of dust that can be removed by the internal photoevaporative wind, sent,IPE, is estimated to be
 (34)
(34)
where zIF and HIF are the height of the ionization front and the gas scale height. We assumed that HIF ~ Hg and zIF = 4HIF as Booth & Clarke (2021) suggested.
As a caveat, we note that for both the gas and dust particles, our model maximizes the losses in noble gases linked to disk evaporation. For example, Burn et al. (2022) showed that if small dust is decoupled from the gas, it is then removed by the photoevaporative wind only at the disk edge. Further studies should determine the extent of vertical settling of dust and even of gases in protoplanetary disks, as these should favor the retention of noble gases in the disk and their accretion by the growing giant planets.
2.2.4 Desorption and condensation of noble gases
Laboratory experiments have indicated three primary processes for the release of volatile gas from amorphous ice: desorption, crystallization, and co-desorption (see Burke & Brown 2010, for details). Desorption refers to the release of volatile gases from the surface of amorphous ice dust. Following desorption a fraction of noble gas species remain trapped within the pores of the amorphous ice. The size of this fraction depends on the formation history and the degree of mixing among ice components. Furthermore, a secondary fraction of volatile gases that persists within the crystalline ice can be released through subsequent desorption. These mechanisms of volatile gas release significantly impact the gas/ice composition in the protosolar disk (Ligterink et al. 2024a). In this study, we assume that noble gases can be released via only desorption. Although the fraction and the temperature of volatile gas released by desorption on the composition of the amorphous ice (e.g., Ligterink et al. 2024a,b), we consider here the simplified case of pure amorphous H2O ice.
We also assumed that the desorption and condensation of noble gases can occur immediately and until the noble gas condensation and sublimation rates are equal. We estimated the desorption and condensation rates and determined the number density of noble gas frozen on the dust surface for each bin so that the condensation rate equals the desorption rate. We assumed that the total number density of each noble gas species is conserved during desorption and condensation events.
The method for estimating the desorption and condensation rates is described in the following (Öberg & Wordsworth 2019). First, the condensation rate is estimated from the number of noble gas molecules hitting the dust surface per unit time and given by
 (35)
(35)
where ndust and ni,gas are the number densities of the dust and each noble gas species, υi is the thermal speed of the species given by  , where µi is the molecular weight of noble gas species. η is the sticking coefficient of the species. Although He et al. (2016) showed that η decreases steeply near the sublimation temperature of the gas species, we assume η = 1 for simplicity. We set sdust to the value calculated in Section 2.2.2. In a more realistic case, the smaller dust can occupy most of the surface area in considering the size distribution of dN ∝ s−3.5ds. However, as shown in Appendix C, incorporating the size distribution does not significantly change our results.
When the frozen molecules do not cover the entire dust surface, all the molecules can sublimate. In this case, the desorption rate is estimated by
 (36)
(36)
where ni,frozen is the number density of the molecules frozen onto the dust surface, vi is the pre-exponential factor, and Edes is the kinetic energy for sublimation. On the other hand, when the molecules cover the entire dust surface, only the molecules on the dust surface can sublimate. The sublimation rate is estimated by
 (37)
(37)
where Ni,sur is the number surface density of the molecules on the dust surface. The typical value of Ni,sur is 1015 cm−2 (e.g., Ciesla et al. 2018).
Some previous studies resulted in low desorption energies for noble gases. SMK2016 estimated Edes for Ar as ~870 K by a desorption experiment of noble gases from an amorphous solid water (ASW) layer. However, the desorption energies depend on the structure of the water ice layer. For example, Ayotte et al. (2001) showed that the desorption rates depend on the porosity of the ASW. SMK2016 dosed the noble gases onto the already prepared ASW layer. On the other hand, L+2024 prepared an ice film made by freezing a mixture of water and noble gases, which exposed the noble gas to more binding sites and pores in the ice. They showed that the mixed ice resulted in higher desorption energies for the surface-bound noble gases. This difference in the preparation of the icy mixture strongly affects the behaviors of the noble gases. Therefore, we consider and compare these two conditions. We summarized Edes and vi, that are also included in Table 2. We note that L+2024 estimated Edes using the peak desorption temperature, Tpeak, obtained from the experimental result and Redhead equation, given as Edes = Tpeak(ln(vTpeak/β) − 3.64), where β is the heating rate (Redhead 1962; Ligterink & Minissale 2023). In contrast, SMK2016 estimated Edes and v using an Arrhenius plot.
Some previous studies suggested that volatile enrichments in the Jovian atmosphere may be explained when all volatile gases are released by the crystallization of H2O amorphous ice (Monga & Desch 2015; Mousis et al. 2019). L+2024 created the ice films by freezing the gas mixtures containing noble gases. They showed that the desorption via the H2O crystallization event accounts for up to 70% of the total released Ar. At the same time, only about 10–15% of Ar is desorbed at the lower temperature, during surface-bound desorption. Minor amounts of Ar are released during water sublimation and between surface-bound desorption and crystallization events. Kr and Xe follow a similar pattern, although larger fractions, up to 90% for Xe, are released during the crystallization event.
Sublimation energies and pre-exponential factors for noble gases.
2.3 Optimization of the simulation parameters
Our goal here is to obtain the parameters of models that yield a global evolution of the disk and planets that is agreement with observational constraints for the Solar System.
The accretion ages of the chondrites suggest that the gas disk of the protosolar nebula remains at least 3–4 Myr after the formation of calcium-aluminum-rich inclusions (CAIs; e.g., Villeneuve et al. 2009; Sugiura & Fujiya 2014). Moreover, observations suggest that most protoplanetary disks disperse in up to ~6−7 Myr (e.g., Haisch et al. 2001; Briceño et al. 2005). We defined the “disk lifetime” as the time when the disk mass becomes lower than 10−5 M⊙. Because the most critical mechanism controlling the disk lifetime is internal photoevaporation, we adjust ƒIPE to obtain values of the disk lifetime close to 4–6 Myr.
For these disk models, we estimate the mass of the Jovian atmosphere with the given equation (Guillot & Hueso 2006):
 (38)
(38)
where Ṁg,52 au is the mass accretion rate in the protosolar disk at 5.2 au (current Jupiter’s position), and eJup is the fraction of that accretion rate which is accreted onto the Jovian core.
Similarly, we calculate the mass in each noble gas i accreted by the growing Jupiter from its local mixing ratio in the disk at 5.2 au, Xi,5.2 au,
 (39)
(39)
where n corresponds to Ar, Kr, or Xe. From the value of MJup,atm,n/MJup,atm, we obtain the enrichment in each noble gas n to be compared to the observational value shown in Table 1. Doing so, we assume that Jupiter’s envelope is well mixed. Since this occurs before helium phase separation has begun (Howard et al. 2024) and since the dilute core mass should be smaller than 50% of Jupiter’s envelope (Howard et al. 2023), this is a reasonable assumption at this point.
We note that the timing of the onset of gas accretion by Jupiter’s core remains uncertain. Although Kruijer et al. (2017) assumed that preventing the mixing of two different isotope reservoirs as observed in iron meteorites would require the formation of a proto-Jupiter 0.5 Myr after CAIs, some computational studies suggest that this dichotomy may also be reproduced without a proto-Jupiter (e.g., Morbidelli et al. 2022). We hence define the onset of gas accretion by Jupiter’s core, tstart, by a time-inverted integration until the Jovian atmospheric mass is equal to MJup − Mcore, where MJup and Mcore are the mass of the current Jupiter and Jovian core, respectively. We set Mcore = 10 Mearth and eJup = 0.3, following Guillot & Hueso (2006). We do not incorporate a decrease in accretion due to the formation of a gap (e.g., Morbidelli & Nesvorny 2012), although in principle this could be incorporated through a time-dependent eJup.
We also checked whether our disk models would allow for bimodal planetesimal formation at the H2O ice line, Tice, and the silicate sublimation line, Tsil, a property required to explain the isotopic dichotomy in iron meteorites (Morbidelli et al. 2022; Marschall & Morbidelli 2023). For this estimation, we assume that planetesimals form via streaming instability (e.g., Youdin & Goodman 2005; Johansen et al. 2014) when the dust-to-gas ratio given by Σd/Σg exceeds a critical value, Zcrit, estimated by Lim et al. (2024):
 (40)
(40)
We set the conversion rate for the planetesimals as 10−4 (Drążkowska et al. 2016).
3 Noble gas enrichment with desorption data from SMK2016
Figure 1 shows the time evolution of gas surface density, dust-to-gas ratio, dust size, and disk midplane temperature with No. S13 parameter sets in Table 3: L* = L⊙, α0 = 0.04, Sc = 1.0, ƒIPE = 0.1, FUV = 10 G0, and ƒvfrag is on. The gas disk shrinks with a 5 Myr timescale. As the fragmentation velocity for ice is ten times higher than for silicates near the H2O ice line which corresponds to T = 170 K, and similar to silicates in low-temperature regions, the spike in the dust size appears near the H2O ice line. In the outer disk, the midplane temperatures are entirely set by irradiation from the central star, while viscous heating plays a more important role in the inner disk, typically near 10 au and less, corresponding to temperatures around 50 K (see also Hueso & Guillot 2005). Since our calculation does not include the evolution of the central star, the outer temperature profile, in a region crucial for the condensation of noble gases, remains mostly independent of time.
We summarize the disk lifetime, noble gas abundance in the Jovian atmosphere, and the flag of bimodal planetesimal formation for each parameter set with desorption energy given by SMK2016 in Table 3. This table shows that solar-like stellar luminosity cannot reproduce the noble gas enrichment in the current Jovian atmosphere. In Appendix A, we show that this remains the case when adopting the classical centrifugal radius relation from Shu (1977).
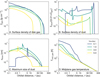 |
Fig. 1 Disk properties for No. S13 parameter sets: L* = L⊙, α0 = 0.04. Sc= 1.0, ƒIPE = 0.1, FUV = 10 G0, and ƒvfrag is on. |
3.1 Dependency on the stellar luminosity
With the desorption energy from SMK2016, the resulting noble gas enrichment in Jupiter is higher for lower values of the stellar luminosity. This result is caused by the position of the ice lines of the noble gases. We tested the lower stellar luminosity case, L* = 0.3 L⊙ and 0.1 L⊙, as an extreme case. Figure 2 shows the noble gas enrichment and each ice line (described by dashed lines) with the parameter sets of no. S13 (L* = L⊙) and no. S5 (L* =0.1 L⊙). The noble gases are enriched at the ice lines, and the enrichment spreads to the inner disk region. This enrichment is caused by the drift of dust with frozen noble gases and increases with the proximity of the ice lines to the central star. That is because more noble gases frozen on the dust surface are required to produce the higher enrichment inside the ice lines. The closer ice line increases the region where noble gases can condense on the dust surface.
The diffusion of enriched material from the outer ice line to Jupiter’s present orbit is a slow process. From Eq. (2), the noble gas steady advection timescale at the ice line, tadv is estimated as
 (41)
(41)
where Tice and rice are the temperature and radius of the ice line, which correspond to ni,gas = ni,frozen from the simulation.
From this timescale and Table 4, the Ar ice line in the case that L* = L⊙ is so far from the central star that all Ar-enriched gas cannot accrete onto the Jovian core during the disk lifetime. Furthermore, the gas can advect outward in the outer disk region. The dashed-dotted line in Figure 2 indicates where the gas advection proceeds outward. Assuming a luminosity equal to the solar one, all noble gases ice lines end up outside this outward-advection line, thus suppressing their inward diffusion. In this case, the photoevaporative wind removes not only the noble-gas-depleted disk gas but also the noble-gas-enriched disk gas before its accretion onto the Jovian core.
In contrast, for cases with a lower stellar luminosity, the ice lines are closer to the central star thus leading to more significant amounts of noble gases frozen on the dust surface and a fast advection of enriched noble gases to 5.2 au. As a result, the noble gas enrichment can become greater than the solar value at 5.2 au, except when the ice line migrates inside there. Moreover, the removed disk gas is more depleted in noble gas species compared to the solar luminosity case. In this case, the Jovian core can accrete more noble-gas-enriched disk gas, and the final Jovian atmosphere can have a higher noble gas abundance. However, it is difficult for a star with solar mass to keep the stellar luminosity lower than solar over 1 Myr (Kunitomo et al. 2021). Justifying such a lower irradiation temperature would thus require an additional mechanism, such as a shielding of the stellar irradiation as discussed in Section 5.4.
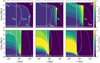 |
Fig. 2 Enrichment of noble gases not frozen on the dust surface, compared to their solar abundances in a protoplanetary disk for the sun-like stellar luminosity (upper row) and the lower stellar luminosity (lower row). The left, center, and right columns show the Ar, Kr, and Xe enrichment. The white solid vertical and horizontal lines show the positions of current Jupiter (5.2 au) and the timing of the Jovian core starting the gas accretion, tstart. The white dotted and dashed lines show the disk edge, rdisk, and the ice lines, rAr, rKr, and rXe. The dashed-dotted lines indicate the radii where the gas velocity is converted to outward, |

Temperatures and radii of ice lines for each noble gas at 1 Myr.
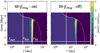 |
Fig. 3 Xe abundance with temperature-dependent fragmentation velocity (No. S8) and the constant fragmentation velocity for ice (No. S9). The parameters except for ƒvfrag are L*, = L⊙, α0 = 0.01, FUV = 10 G0, Sc = 0.1, and ƒIPE = 0.25. |
3.2 Dependency on other parameters
3.2.1 Effect of a temperature-dependent fragmentation velocity for ice, fvfrag
If ƒvfrag is on, the stickiness of the icy dust is similar to silicates in the lower temperature region (T ≲ 120 K). In this region, icy dust cannot grow into icy ‘pebbles’ and tends to spread to the outer disk region. This effect increases the total dust mass and consequently the total dust surface area. The left and right panels of Figure 3 show Xe enrichment of the disk with the same parameter sets except for ƒvfrag. If ƒvfrag is on, the enrichment near the Xe ice line increases. Figure 4 illustrates the mass ratio of disk gas inside the Xe ice line, the dust beyond the Xe ice line, and the ratio of Xe enrichment inside the Xe ice line for case no. S8 (ƒvfrag: on) compared to Case No. S9 (ƒvfrag: off). Notably, the Xe enrichment ratio surpasses 1 when the dust mass ratio also exceeds 1, even when the mass ratio of disk gas inside the ice line is close to 1. This indicates that Xe enrichment is influenced by the dust mass located outside the Xe ice line. Specifically, as the total surface area outside the Xe ice line increases, the amount of Xe frozen on the dust surface also rises.
3.2.2 Schmidt number, Sc
The enriched noble gas can be spread inward by diffusion and advection. The diffusion timescale is estimated to be
 (42)
(42)
Comparing Eq. (42) to Eq. (41), when Sc < 1, the diffusion is negligible compared to advection. On the other hand, gas diffusion can spread noble gas enrichment and advection when Sc = 1.0. The right panel of Figure 5 shows the Xe enrichment when Sc = 1.0. The enrichment spreads faster than the Sc = 0.1 case (left panel of Figure 5). These panels show that higher enrichment requires a higher Sc value. However, the higher Sc also weakens the dust pile-up at the silicate sublimation line, which is required to create the rocky planetesimals via streaming instability. As shown in Table 3, the higher Sc value cannot reproduce the bimodal planetesimal formation region.
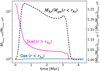 |
Fig. 4 Ratio of the mass and enrichment for case no. S8 (ƒvfrag : on) compared to case no. S9 (ƒvfrag: off). The blue line represents the mass ratio of the gas disk inside the Xe ice line, rXe. The magenta line represents the mass ratio of the dust outside the Xe ice line. The black dashed line represents the ratio of Xe enrichment inside the Xe ice line. |
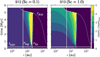 |
Fig. 5 Xe abundance for the different Sc values, Sc = 0.1 (No. S12) and Sc = 1.0 (No. S13). The parameters except for Sc are L* = L⊙, α0 = 0.04, FUV = 10 G0, ƒIPE = 0.1, and ƒvfrag is on. |
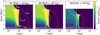 |
Fig. 6 Kr enrichment in the disk for different parameter sets. The left, center, and right panels show the results with the parameter sets of No. S1 (FUV =10 G0), S2 (FUV = 103G0), and S3 (FUV = 105 G0). The meanings of the lines are the same as Figure 2. The parameters except for FUV are L* = 0.1 L⊙, α0 = 0.04, ƒIPE = 0.1, and ƒvftag is on. |
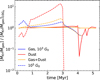 |
Fig. 7 Total mass ratio of Kr to the disk gas for the cases with higher FUV fields compared to the lower FUV field case. The blue and red lines show the Kr mass ratio, which exists in the gas phase and freezes onto the dust surface. The orange line shows the mass ratio of the total amount of Kr to the disk gas. |
3.2.3 Interstellar FUV field
A higher FUV field affects the strength of external photoevaporation (EPE), strongly affecting the disk’s outer edge and leading to smaller disks. Guillot & Hueso (2006) showed that a higher mass-loss rate due to EPE leads to a higher enrichment in noble gases in Jupiter, with values that can match the observational constraints. However, our simulations, in which vaporized noble gases are not confined to the disk midplane, and dust migration is included, show the opposite trend. This is seen by comparing model No. S1, S2, and S3 in Table 3: the noble gas abundance in Jupiter decreases with an increase in the FUV field strength.
Figure 6 shows the Kr enrichment in the disk for the different FUV field strengths (Nos. S1, S2, and S3). When FUV = 105 G0, even though Kr is enriched at the Kr ice line, rKr, the enrichment does not spread enough to the current Jupiter’s position. The total mass enrichment of noble gases increases with increasing FUV field. Figure 7 shows the total mass ratio of Kr to the disk gas for the cases FUV = 103 G0 and FUV = 105 Go compared to the FUV = 10 G0 case. While the Kr mass enrichment with FUV = 103 G0 is similar to that in FUV = 10 G0 case, that with FUV = 105 G0 is higher until 3 Myr. However, after 3 Myr, the Kr enrichment decreases abruptly. This time corresponds to when the disk edge migrates inside the Kr ice line. At this stage, Kr cannot freeze onto dust grains to be transported to the inner disk anymore. (We note that although Poynting-Robertson drag may cause an inward migration of solids outside the gas disk edge, this effect only works efficiently after the gas disk has disappeared (Burn et al. 2022).)
Moreover, for an extreme UV flux, FUV = 105 G0, another event occurs: As shown in Fig. 8, the total dust-to-gas mass ratio abruptly decreases after 0.5 Myr. This is because dust grains, generally diffusing outward during the infall stage, are affected by the smaller gas density due to extreme photoevaporation and migrate inward. This smaller dust-to-gas mass ratio leads to a smaller maximum dust size limited by radial drift, as given by Eq. (28). Thus, the radial inward velocity for the dust is slower than for the lower FUV field cases, as described in Figure 9. This slower radial dust drift carries less noble gas inside its ice lines. This effect could not be captured by the simpler model of Guillot & Hueso (2006), which did not incorporate dust growth and radial drift.
The Ar enrichment for higher FUV strength requires a lower stellar luminosity since the Ar ice line with sun-like stellar luminosity is beyond the disk edge with a higher FUV field, as shown in Table 4. However, Monga & Desch (2015) suggested that amorphization of the H2O ices in the outer disk region could trap noble gases inside them. As these authors supposed that amorphization could be caused by interstellar FUV radiation, the stronger FUV field could allow for noble gases to become retrapped into the amorphous ice. The incorporation of this mechanism in simulations is left to a future work.
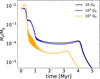 |
Fig. 8 Time evolution of total mass ratio of dust (Md) to gas (Mg) for the different FUV fields. The black, blue, and orange lines indicate the results for FUV = 10 G0, 103 G0, 105 G0. The see-saw pattern is caused by condensation and sublimation of H2O ice, silicates, and refractory materials. |
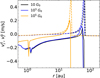 |
Fig. 9 Radial velocities of gas and dust at 2 Myr for the different FUV fields. The black, blue, and orange lines indicate the results for FUV = 10 G0, 103 G0, 105 G0. The solid and dashed lines show the radial velocities of dust and gas. The positive value indicates the outward velocity, and the negative value indicates the inward velocity. |
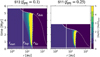 |
Fig. 10 Xe abundance for the different ƒIPE values: ƒIPE = 0.1 (No. S12) and ƒIPE = 0.25 (No. S11). The parameters for all (apart from ƒIPE) are L* = L⊙, α0 = 0.04, FUV = 10 G0, and ƒvfrag is on. |
3.2.4 Influence of factor for Internal photoevaporation, fIPE
The factor controlling the mass-loss rate by IPE, ƒIPE, affects the timescale with which the disk shrinks and eventually disappears. The Xe enrichment with ƒIPE = 0.25 (right panel of Figure 10) spreads more slowly than for the case with ƒIPE = 0.1 (left panel of Figure 10). This slower spreading is caused by the difference in gas radial velocity. As shown in Figure 9, the gas and dust spread outward rather than accrete inward around the disk edge, rdisk. In the inner disk region, the gas accretion velocity is slower as it is influenced by the gas’s outward velocity. Thus, as the gas disk edge in the larger ƒIPE case migrates faster, the noble gases cannot spread as much as in the lower ƒIPE case. Moreover, the gas advection timescale is similar to or greater than the order of magnitude of disk lifetime, as shown in Eq. (41). This value implies that the noble gas enrichment requires a longer disk lifetime.
3.2.5 Effect of the initial turbulent strength, α0
Figure 11 shows the Xe enrichment obtained for different initial turbulent strengths α0 (S8, S11, and S14). With the exception of the test case using α = 0.01, we adopted α0 = 0.04 and the combination of α0 = 0.1 and tinfall = 6.3 × 10⁴ years to obtain the maximum dust radius following Marschall & Morbidelli (2023). This parameter affects the spread of the gas disk and the disk lifetime: At an early stage, the outer edge of the disk spreads more rapidly with a higher α0, but this leads to more efficient transport of gas to regions where photoevaporation is efficient, yielding a shorter disk lifetime. The wider disk allows for more noble gases to condense on the dust surface. However, as discussed in Sect. 3.2.4, the closer disk edge also negatively affects noble gas enrichment. Therefore, while the higher initial turbulent strength can yield a higher noble gas enrichment near the ice lines initially, this effect is eventually erased by the faster disappearance of the disk.
4 Noble gas enrichment with desorption data from L+2024
In Section 3, we show that assuming a solar luminosity for the central star yields models that cannot reproduce Jupiter’s enrichment in noble gases in the Jovian atmosphere. We also show that some models, assuming a ten-times smaller luminosity and therefore closer ice lines, were able to match the observations in very specific cases.
On the other hand, higher desorption energies suppress noble gas desorption and contribute to closer ice lines. Table 4 shows the desorption temperatures and radii of the ice lines with experimental data from L+2024, which shows the higher desorption energy as shown in Table 2. Compared to the SMK2016 values, the ice lines are closer to Jupiter’s current position for solar stellar luminosity. We show the noble gas enrichment with No. L3 (low stellar luminosity) and L9 (solar luminosity) parameter sets in Figure 12. As illustrated in this figure, the noble gas enrichment exceeds unity at 5.2 au for more than 4 Myr in this case. By accretion of this enriched gas on the Jovian core surface, the final abundance of noble gas species is more consistent with the observational value than when assuming the desorption energies and temperatures of SMK2016 (Figure 13).
We summarize the results with data from L+2024 in Table. Since we found that the lower FUV field and the temperature-dependent fragmentation velocity for H2O ice can contribute to a higher enrichment in Sect. 3, we turn on ƒvfrag for all cases. For a low stellar luminosity, we find that contrary to the case with SMK2016 adsorptions, the ice lines are now always inside 5.2 au, and noble gas abundances in the Jovian atmosphere are always incompatible with observations. However, with normal luminosities, several models yield noble-gas abundances that are compatible with the Galileo probe constraints in Jupiter’s atmosphere. This is, in particular, the case of model L7, which has a standard stellar luminosity, α0 = 0.01, a standard value of the Schmidt number at 0.1, a value of internal photoevaporation ƒIPE =0.1 that is lower than the model but yields a disk lifetime of 7 Myr that is compatible with the observations and allows for the early formation of planetesimals in two different regions compatible with the meteoritic constraints (Morbidelli et al. 2022). For this model, the enrichment in Ar to Xe ranges from 2.6 to 4.1, which is approximately compatible with the observations when accounting for the uncertainties in the Galileo probe determinations, but slightly higher than expected for Xe (Atreya et al. 2018; Guillot et al. 2023). Sect. 5.5 hereafter shows that the trend in Ar to Xe enrichment can be modified by accounting for a faster growth of Jupiter than assumed here.
The parameter dependence of the final enrichment is similar to that in Sect. 3 except for stellar luminosity. The stronger FUV field suppresses the enrichment of noble gas species in the Jovian atmosphere even with their closer ice lines (Table 5).
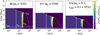 |
Fig. 11 Xe enrichment in the disk for different initial turbulent strengths. The left, center, and right panels show the results with the parameter sets of No. S8 (α0 = 0.01), S11 (α0 = 0.04), and S14(α0 = 0.1). The meanings of the lines are the same as Figure 2. We set tinfall = 6.3 × 10⁴ year to obtain the largest dust disk radius (see Figure 6 in Marschall & Morbidelli 2023). The parameters except for α0 are L* = L⊙, FUV = 10 G0, ƒIPE = 0.1, Sc = 0.1, and ƒvfrag is on. |
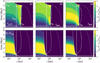 |
Fig. 12 Enrichment of noble gases compared to their solar abundances in a protoplanetary disk for the sun-like stellar luminosity (upper row) and the lower stellar luminosity (lower row) obtained with the desorption parameters from L+2024. The left, center, and right columns show the Ar, Kr, and Xe enrichment. The white solid and dotted lines show the positions of current Jupiter (5.2 au) and disk edge, rdisk. The dashed-dotted lines indicate the radii where the gas velocity is converted to outward, |

5 Discussion
5.1 Consequences of noble gas desorption and entrapment models
5.1.1 Effect on noble gas abundances in the disk
We discuss the fact that higher desorption energies can increase the desorption temperatures in Section 4. However, although Edes for Ar obtained by L+2024 is lower than that for Xe obtained by SMK2016, the desorption temperature of Ar is higher. This is due to a higher nAr,tot/nH. From Eqs. (35)–(37), the estimation of desorption temperature, Tdes is given by
 (43)
(43)
where
![Mathematical equation: ${T_{{\rm{des,1}}}}\~18\left( {{{{E_{{\rm{des}}}}} \over {860\,{\rm{K}}}}} \right){\left[ {1 - 0.073\,\ln \left( {{{{T_1}} \over {18\,{\rm{K}}}}} \right) + {C_1}} \right]^{ - 1}}\,K,$](/articles/aa/full_html/2025/11/aa55204-25/aa55204-25-eq59.png) (44)
(44)
where
![Mathematical equation: ${T_{\rm{1}}}\~18\left( {{{{E_{{\rm{des}}}}} \over {860\,{\rm{K}}}}} \right){\left[ {1 + {C_1}} \right]^{ - 1}}\,K,$](/articles/aa/full_html/2025/11/aa55204-25/aa55204-25-eq60.png) (45)
(45)
and
![Mathematical equation: $\eqalign{ & {C_1} = 0.021[\ln \left( {{{{\nu _1}} \over {{{10}^{12}}\,{{\rm{s}}^{ - 1}}}}} \right) - \ln \left( {{{{\Sigma _{\rm{d}}}/{\Sigma _{\rm{g}}}} \over {{{10}^{ - 2}}}}} \right) - \ln \left( {{{{\Sigma _{\rm{g}}}} \over {1\,{\rm{g/c}}{{\rm{m}}^2}}}} \right) \cr & \,\,\,\,\,\,\,\,\,\,\,\,\, + \ln \left( {{{{s_{{\rm{dust}}}}} \over {1\,\mu {\rm{m}}}}} \right) + \ln \left( {{{{L_*}} \over {1\,{L_ \odot }}}} \right) + 0.5\,\ln \left( {{{{\mu _i}} \over {36}}} \right)], \cr} $](/articles/aa/full_html/2025/11/aa55204-25/aa55204-25-eq61.png) (46)
(46)
and
![Mathematical equation: ${T_{{\rm{des,2}}}}\~18\left( {{{{E_{{\rm{des}}}}} \over {860\,{\rm{K}}}}} \right){\left[ {1 - 0.074\,\ln \left( {{{{T_2}} \over {18\,{\rm{K}}}}} \right) + {C_2}} \right]^{ - 1}}\,{\rm{K,}}$](/articles/aa/full_html/2025/11/aa55204-25/aa55204-25-eq62.png) (47)
(47)
where
![Mathematical equation: ${T_{\rm{2}}}\~18\left( {{{{E_{{\rm{des}}}}} \over {860\,{\rm{K}}}}} \right){\left[ {1 + {C_2}} \right]^{ - 1}}\,{\rm{K,}}$](/articles/aa/full_html/2025/11/aa55204-25/aa55204-25-eq63.png) (48)
(48)
and
![Mathematical equation: $\eqalign{ & {C_{\rm{2}}} = 0.021[ln\left( {{{{\nu _i}} \over {{{10}^{12}}\,{{\rm{s}}^{ - 1}}}}} \right) - ln\left( {{{{n_{i,\,{\rm{tot}}}}/{n_{\rm{H}}}} \over {{{10}^{ - 6}}}}} \right) \cr & \,\,\,\,\,\,\,\,\,\,\,\,\,\,\,\,\,\,\, - ln\left( {{{{\Sigma _{\rm{g}}}} \over {1\,{\rm{g/c}}{{\rm{m}}^2}}}} \right) + ln\left( {{{{L_*}} \over {1\,{L_ \odot }}}} \right) + 0.5\,ln\left( {{{{\mu _i}} \over {36}}} \right)]. \cr} $](/articles/aa/full_html/2025/11/aa55204-25/aa55204-25-eq64.png) (49)
(49)
The derivation of these equations is described in Appendix B. From Eqs. (47)–(49), the desorption temperature increases with the ni,tot/nH. As shown in Table 1, the solar Ar abundance is more than 104 times higher than Xe. This difference results in the desorption temperatures opposite to the desorption energy.
We note that our model did not consider the change in trapping efficiency, η. L+2024 suggested that the trapping efficiency decreases with the increase in  , and Ar trapping efficiency is up to 80%. Their result suggested that the desorption temperature for Ar can change Tdes,2 to Tdes,1 due to the low fraction of Ar gas trapped in the ice.
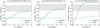 |
Fig. 13 Noble gas abundance in Jovian atmosphere with data from SMK2016 (No. S13) and L+2024 (No. L9). The grey areas show the observational value obtained by Galileo prove (Mahaffy et al. 2000). The disk parameter sets are L* = L⊙, α0 = 0.04, Sc = 1.0, ƒIPE = 0.1, FUV = 10 G0, and ƒvfrag is on. |
5.1.2 Releasing noble gases at the water crystallization line
Our results suggest that noble gas enrichment in the Jovian atmosphere requires higher desorption energies than usually assumed, such as those obtained by L+2024. These findings are based on the assumption that all noble gases condense at the ice lines corresponding to the specified desorption energies. However, the desorption experiment conducted by L+2024 used an ice mixture that also contains noble gases trapped in deeper layers. Since noble gases primarily recondense on the surface of amorphous ice, the ice lines for recondensation should be determined using the desorption energies provided by SMK2016, which are specific to the surface of amorphous ice. Furthermore, when exposed to fewer binding sites, noble gases recondensed on the dust surface may sublimate at the same ice lines as their recondensation points. To prevent the desorption of noble gases recondensed on the dust surface, they must be trapped within the deeper layers of amorphous ice. L+2024 considered that the ice mixture forms in the previous stage of the protosolar disk. Therefore, their data are more appropriate for a scenario where the mixed noble gas H2O ice is inherited from the previous stage. Trapping noble gases within the deeper layers could also be achieved through the simultaneous recondensation of water vapor and noble gases (Monga & Desch 2015). Under these conditions, noble gas enrichment is expected to increase inside the desorption line determined from the data provided by L+2024, similar to the pattern (A) shown in Figure 14 below.
Also, while we assumed that all noble gases frozen in dust desorb in ice lines, L+2024 showed that more than half of the noble gases still remain inside the amorphous H2O ice layer in the region which is hotter than the desorption temperature. They are mainly released at the H2O-crystallization line. This result may increase the enrichment of noble gases inside the H2O crystallization line, rcry. Figure 14 shows the Kr enrichment of the disk with the desorption of all noble gases at the H2O-crystallization line, where we assumed rcry to correspond to 143 K (Mousis et al. 2019). The left panel (A) is the result with the assumption that noble gases are released only at rcry and condense at their ice lines, and the right panel (B) is based on the assumption that the noble gases released at rcry condense and sublimate at their ice lines. Since our model assumed that all materials fall within the RC ≲ 0.35 au, all amorphous ices undergo crystallization at first. Therefore, the assumption of pattern (B) reproduces a result similar to No. S13. For pattern (A), the noble gas enrichment increases inside rcry. Although the enrichment diffuses outward, it is not high enough at 5.2 au. Table 6 shows the noble gas abundance in the Jovian atmosphere for desorption through H2O-crystallization. As mentioned above, the pattern (B) values are similar to No. S13. On the other hand, in pattern (A), all noble gas abundances increase, but the values are insufficient to explain the observation. To increase the enrichment at 5.2 au, the farther rcry is required. Based on the H2O crystallization experiment (Smith et al. 2011) and the estimation of the effective reaction temperature on a disk (Ishizaki et al. 2023), the crystallization line can move to ~120 K2. However, the midplane temperature where the crystallization occurs is in the viscous heating region, which has a steep gradient for r (Figure 1). This small difference between 143 K and 120 K cannot move rcry significantly. Some fraction of noble gases can be released at the desorption temperature obtained by L+2024. This effect may increase the enrichment at 5.2 au.
Mousis et al. (2019) also calculated the abundance of noble gases released by the crystallization of H2O ice in the gas disk and suggested that this desorption can reproduce enrichment in the Jovian atmosphere. The discrepancy in our findings can be attributed to the gas disk model used. Mousis et al. (2019) assumed a steady-accretion disk, which allows for a significant flux of amorphous ice. Specifically, their model estimates the flux of amorphous ice at the crystallization line at 2 Myr to be ~7.1 × 10⁻¹⁰ M⊙/year, whereas our model estimates a much lower flux of ~2.13 × 10⁻¹² M⊙/year. Additionally, we tested the “Shu” centrifugal radius model (Shu 1977, see Appendix A) for pattern A. This model results in a more massive and larger disk, leading to increased flux and enrichment (Table 6). Therefore, this desorption model is more suitable for larger and more massive disks.
However, the larger disk model may be inconsistent with the distribution of CAIs, which are believed to form by condensation in the hotter region (T ≳ 1500 K) very close to the sun. These CAIs then spread to the outer disk regions through the viscous evolution of the gas disk (e.g., Nanne et al. 2019; Morbidelli et al. 2022). Marschall & Morbidelli (2023) noted that the CAI distribution is difficult to explain using the Shu model. Alternatively, to account for the CAI distribution, the larger disk might necessitate dust transport by disk winds (e.g., Giacalone et al. 2019).
In any case, our result implies that the sufficient trapping of noble gases inside the amorphous ice is the origin of the noble gas enrichment in the Jovian atmosphere. However, in the inside-out disk model, most noble gases are released during the infall stage. These noble gases are expected to condense onto the dust surface at the ice lines determined by the desorption energies of SMK2016 and desorb at the same ice lines. Therefore, to explain the composition of the Jovian atmosphere based on the inside-out disk model, mechanisms such as the retrapping of noble gases into amorphous ice (e.g., through the size growth of amorphous ice, as suggested by Monga & Desch 2015) or the supply of new amorphous ice from streamers to the outer disk region (Pineda et al. 2020; Valdivia-Mena et al. 2022; Cacciapuoti et al. 2024), would be necessary.
Noble gas enrichment in Jovian atmosphere with desorption via H2O crystallization.
5.2 Noble gas transport by clathrates
Another possible mechanism for noble gases to become trapped on the H2O-icy dust surface is through clathrate formation. When H2O ice is sufficiently abundant in the protosolar disk, volatile species can be incorporated into clathrates (Lunine & Stevenson 1985; Gautier & Hersant 2005; Mousis et al. 2021). Schneeberger et al. (2023) investigated the effect of clathrate on volatile abundances through numerical simulations. Their results showed that Kr and Xe can become enriched around the ‘clathrate’ lines, which correspond to disk temperatures of approximately 45 K and 65 K. In contrast, the abundance of Ar does not increase significantly around its clathrate line.
5.3 Possible slow diffusion of Ar
Our results suggested a lower enrichment of Ar in the Jovian atmosphere. It may be the opposite trend of the observation: Ar is more enriched than the other noble gases (e.g., Atreya et al. 2018; Guillot et al. 2023). This trend could be explained by the slow diffusion of Ar in amorphous ice. L+2024 suggested that volatile gas can be released via slow diffusion through bulk amorphous ice. As the timescale of the diffusion decreases with the volatility of the molecules, Ar is expected to desorb via diffusion more than Kr and Xe. If the amorphous ice trapping noble gases inside accumulates at the gas gap created by the proto-Jupiter, Ar could be released from the ice more than Kr and Xe and accrete onto the Jovian core.
5.4 Possible shadow in the disk
Our results suggested that a lower disk temperature is required for noble gas enrichments in the Jovian atmosphere when the noble gases are trapped only on the dust surface. One possible mechanism for colder disk temperature is the “shadow area” (e.g., Ueda et al. 2019; Ohno & Ueda 2021). This mechanism is based on the idea that the piled-up dust blocks stellar irradiation behind it. Ohno & Ueda (2021) showed that the disk temperature outside the H2O snow line could decrease below 30 K, thus allowing the condensation of all noble gases directly. This model, however, remains to be studied quantitatively within the framework of the evolution of a protoplanetary disk with both gas, dust, and the growth of Jupiter self-consistently taken into account.
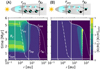 |
Fig. 14 Kr enrichment with two conditions for the desorption via H2O crystallization: (A) noble gases are released only inside rcry and condense only outside their ice lines estimated by SMK2016. (B) Noble gases released at rcry condense and sublimate at their ice lines estimated by SMK2016. The disk parameters are the same as No. S13. |
Starting timing of gas accretion and noble gas enrichment in the Jovian atmosphere when eJup = 0.8.
5.5 Considering a faster growth of Jupiter
The bimodal planetesimal formation requires a low Schmidt number, which generally prevents the diffusion of enriched noble gases. As shown in Figure 12, the timing when the noble gas enrichment at 5.2 au starts to increase is later than the timing of the start of gas accretion on Jupiter’s core, tstart with eJup = 0.3. However, some studies suggested a runaway gas accretion of Jupiter (e.g., Tanaka et al. 2020). Thus, eJup can be higher than 0.3, which results in a later tstart.
Table 7 shows the noble gas enrichments obtained with Sc = 0.1 and L* = L⊙ in Table 5 when eJup = 0.8. Ar abundance increases for all cases because the Jovian core accretes the less Ar-depleted disk gas. On the other hand, the Xe abundance of No. L7 is lower than in the eJup case. As shown in the upper panel of Figure 12, Xe enrichment increases and decreases earlier than that of the other noble gases at 5.2 au. Since fstart of No. L7 with eJup is later than the other parameter sets, the earlier Xe enrichment is excluded in this case.
5.6 Uncertainty in the photoevaporative gas disk evolution
Our results showed that the higher noble abundance and also a disk lifetime compatible with observational constraints require a lower mass-loss rate by photoevaporation than generally assumed (Sect. 3.2.4). Regarding IPE, our result requires the mass-loss rate to be lower by about an order of magnitude than the estimation provided by Ercolano et al. (2021). The value of fIPE = 0.1 is consistent with a recent prediction by Sellek et al. (2024). While Picogna et al. (2021) and Ercolano et al. (2021) adopted a simplified temperature calculation using the ionization parameter, Sellek et al. (2024) considered a self-consistent thermochemistry and suggested a lower X-ray IPE.
Although the gas disk evolution is crucial for noble gas enrichment, it has still been actively discussed in the community. For example, we considered X-ray IPE but ignored FUV and EUV radiation from the central star. Nakatani et al. (2018a,b) showed that the FUV IPE rate can be orders of magnitude lower compared to that by X-ray when small dust grains are depleted due to dust growth (see also Nakatani et al. 2021). Magnetic disk winds can also drive mass loss and accretion by magnetic braking (Suzuki et al. 2016; Kunitomo et al. 2020). Moreover, they may suppress IPE in the early phase by shielding X-ray and UV irradiation (Takasao et al. 2018). Detailed discussions of the uncertainty in gas disk evolution are beyond the scope of this study, and we present models that reproduce the observed constraints of disk lifetime. Still, further precise understanding of processes in the evolution of the gas disk is highly encouraged.
5.7 Prediction for Saturn, Uranus, and Neptune
The noble gas enrichments of Saturn, Uranus, and Neptune remain uncertain. If the noble gases in their atmospheres were accreted from the disk gas, our model can predict the expected trends. When all noble gases are released only at their respective ice lines, the noble gas enrichment in the disk should follow the distribution shown in Figure 2 or Figure 12. In this case, noble gas enrichment should increase as the distance between the planet and the desorption line decreases. Consequently, Saturn’s atmosphere is expected to have a higher noble gas abundance.
On the other hand, if noble gases are released at the H2O crystallization line and desorption line obtained by L+2024, and subsequently retrapped at the desorption line obtained by SMK2016, Figure 14 suggests that Saturn’s atmosphere would have a lower noble gas abundance. Therefore, comparing the noble gas abundance in Saturn’s atmosphere with that in Jupiter’s atmosphere could help distinguish between these two desorption models.
Noble gases may exist in the solid phase within the formation regions of Uranus and Neptune. However, since the Xe isotopic composition in comets differs from that in both the Sun and Jupiter’s atmosphere, analyzing the Xe isotopic composition in the atmospheres of Uranus and Neptune could help determine whether Xe gas in their atmospheres originates from solids or disk gas. Understanding the position of the Xe ice line in the protosolar disk is crucial. If the Xe ice line lies beyond the orbits of Uranus and Neptune, the predictions for Saturn’s atmosphere could also apply to their atmospheres.
6 Conclusion
The abundance of noble gases in the Jovian atmosphere is two to four times higher than the solar value. Guillot & Hueso (2006) proposed disk photoevaporation to potentially explain this noble gas enrichment. However, their study did not account for dust motion or the desorption and condensation of noble gases in the disk. To address this gap, we investigate noble gas enrichment using the Diskbuild code developed by Morbidelli et al. (2022) and Marschall & Morbidelli (2023), incorporating these additional effects.
We tested two desorption energies for noble gases: (1) measured for amorphous ice layers dosed with noble gases on their surfaces (SMK2016) and (2) measured for ice films formed by freezing mixtures of H2O and noble gases, leading to deeper binding of noble gases (L+2024). In the former case, corresponding to the standard assumption, the noble gas enrichment in the Jovian atmosphere may be reproduced only when we assume an unlikely order-of-magnitude reduction of the stellar luminosity. In the latter case, the higher desorption temperatures from (L+2024) call for for solutions with a standard luminosity for the protosun that also account for the simultaneous formation of planetesimals at two locations. For one case, model L7 (see Table 5), we obtain noble gas abundances in Jupiter that are enriched between 2.6 and 4.1 times the solar value, with precise values that might be fine-tuned to account more precisely for the Galileo probe constraints. We stress that model L7 also yields an early formation of two planetesimal belts, as required to explain the isotopic dichotomy of iron meteorites (Morbidelli et al. 2022; Marschall & Morbidelli 2023).
We thus confirm the importance of a removal of metallicity-depleted disk gas by photoevaporation to account for the final masses and compositions of giant planets, as proposed by Guillot & Hueso (2006). However, compared to their results, our models require considerably more fine-tuning and allow for the measured abundances in Jupiter to be matched only in a narrow range of the parameter space. The main reason is that, contrary to that earlier study, we included dust drift and assumed an efficient vertical mixing of gases evaporated from dust grains in the midplane. This enabled the evaporation of both hydrogen and helium but also noble gases from the disk, considerably limiting the enrichment obtained in the inner protosolar disk.
Specifically, we find that some external photoevaporation is mandatory in order both to remove low-metallicity gas from the outer disk that would otherwise be re-accreted by the giant planets, and to keep the disk lifetime compatible with mete-oritic constraints. However, contrary to Guillot & Hueso (2006), we find that external photoevaporation should be limited to a relatively small value of the FUV flux G0 ~ 10.
This might imply that the Sun would have formed either in a small cluster or in its outskirts (e.g., Adams et al. 2004; Fatuzzo & Adams 2008). However, the fact that Emsenhuber et al. (2023) also requires low values of G0 to reproduce the lifetimes of disks as observed by ALMA indicates that, alternatively, this may be due to an overestimation of the photoevaporation rate.
An alternative scenario is the desorption of all noble gases at the H2O crystallization line (Monga & Desch 2015; Mousis et al. 2019), which seem to enable solutions across a wider range of the parameter space. We confirm that this scenario works well for disk models assuming a classical centrifugal radius from Shu (1977). However, these models fail to reproduce the bimodal planetesimal formation at the H2O and silicate sublimation lines (Appendix A). While admittedly our exploration of the parameter space was limited, for models assuming an inside-out accretion (Marschall & Morbidelli 2023), we were unable to find solutions yielding an envelope of Jupiter that is enriched in noble gases.
Progress in this area will require further models. In particular, calculating more precisely how gases vaporized from migrating dust grains are mixed vertically and whether they efficiently reach the photoevaporation regions will critically determine the magnitude of the enrichment of the inner protoplanetary disks. A suppression of vertical mixing would certainly favor a wider range of solutions compatible with solar system observations. The presence of structures in disks is also a very important complication that is sure to affect both the drift timescales and the enrichment, but we were not able to take this into account here. The combined formation of Jupiter, Saturn, Uranus, and Neptune in a protosolar disk, including gas and dust, should be investigated. Finally, more observations are needed; in particular, measurements of noble gases in other solar system giant planets than Jupiter. Because of their transparency, this requires in situ measurements with a probe. Uranus and Saturn appear to be the next key targets and their study would allow us to discriminate between different models (e.g., Mousis et al. 2022; Guillot 2022; Hofstadter et al. 2024).
Acknowledgements
We thank Alessandro Morbidelli for helpful discussions and for sharing the Diskbuild code. We also thank the anonymous referee for a thoughtful and insightful review. This work was supported by JSPS Kakenhi 23KJ0885, 22K21344, and 23K25923 and the Swiss National Science Foundation (SNSF) Ambizione grant 193453. T.O. and M.K. thank the Observatoire de la Côte d’Azur and the Laboratoire Lagrange for their hospitality during their long-term stay in Nice.
References
- Adams, F. C., Hollenbach, D., Laughlin, G., & Gorti, U. 2004, ApJ, 611, 360 [NASA ADS] [CrossRef] [Google Scholar]
- Anders, E., & Grevesse, N. 1989, Geochim. Cosmochim. Acta, 53, 197 [Google Scholar]
- Asplund, M., Grevesse, N., Sauval, A. J., & Scott, P. 2009, Annu. Rev. Astron. Astrophys., 47, 481 [CrossRef] [Google Scholar]
- Atreya, S. K., Crida, A., Guillot, T., et al. 2018, in Saturn in the 21st Century, eds. K. H. Baines, F. M. Flasar, N. Krupp, & T. Stallard (Cambridge University Press), 5 [Google Scholar]
- Ayotte, P., Smith, R. S., Stevenson, K. P., et al. 2001, J. Geophys. Res., 106, 33387 [Google Scholar]
- Bell, K. R., & Lin, D. N. C. 1994, ApJ, 427, 987 [NASA ADS] [CrossRef] [Google Scholar]
- Birnstiel, T., Klahr, H., & Ercolano, B. 2012, A&A, 539, A148 [NASA ADS] [CrossRef] [EDP Sciences] [Google Scholar]
- Bitsch, B., & Mah, J. 2023, A&A, 679, A11 [NASA ADS] [CrossRef] [EDP Sciences] [Google Scholar]
- Blum, J., & Wurm, G. 2000, Icarus, 143, 138 [NASA ADS] [CrossRef] [Google Scholar]
- Bodenheimer, P., & Pollack, J. B. 1986, Icarus, 67, 391 [Google Scholar]
- Booth, R. A., & Clarke, C. J. 2021, MNRAS, 502, 1569 [NASA ADS] [CrossRef] [Google Scholar]
- Bosman, A. D., Cridland, A. J., & Miguel, Y. 2019, A&A, 632, L11 [NASA ADS] [CrossRef] [EDP Sciences] [Google Scholar]
- Briceño, C., Calvet, N., Hernández, J., et al. 2005, AJ, 129, 907 [Google Scholar]
- Budde, G., Burkhardt, C., Brennecka, G. A., et al. 2016, Earth Planet. Sci. Lett., 454, 293 [Google Scholar]
- Burke, D. J., & Brown, W. A. 2010, Phys. Chem. Chem. Phys., 12, 5947 [NASA ADS] [CrossRef] [Google Scholar]
- Burn, R., Emsenhuber, A., Weder, J., et al. 2022, A&A, 666, A73 [NASA ADS] [CrossRef] [EDP Sciences] [Google Scholar]
- Cacciapuoti, L., Macias, E., Gupta, A., et al. 2024, A&A, 682, A61 [NASA ADS] [CrossRef] [EDP Sciences] [Google Scholar]
- Carballido, A., Stone, J. M., & Pringle, J. E. 2005, MNRAS, 358, 1055 [NASA ADS] [CrossRef] [Google Scholar]
- Chiang, E. I., & Goldreich, P. 1997, ApJ, 490, 368 [Google Scholar]
- Ciesla, F. J., Krijt, S., Yokochi, R., & Sandford, S. 2018, ApJ, 867, 146 [NASA ADS] [CrossRef] [Google Scholar]
- Drazkowska, J., & Alibert, Y. 2017, A&A, 608, A92 [CrossRef] [EDP Sciences] [Google Scholar]
- Coleman, G. A. L., Mroueh, J. K., & Haworth, T. J. 2024, MNRAS, 527, 7588 [Google Scholar]
- Drazkowska, J., Alibert, Y., & Moore, B. 2016, A&A, 594, A105 [CrossRef] [EDP Sciences] [Google Scholar]
- Emsenhuber, A., Burn, R., Weder, J., et al. 2023, A&A, 673, A78 [NASA ADS] [CrossRef] [EDP Sciences] [Google Scholar]
- Ercolano, B., Picogna, G., Monsch, K., Drake, J. J., & Preibisch, T. 2021, MNRAS, 508, 1675 [NASA ADS] [CrossRef] [Google Scholar]
- Fatuzzo, M., & Adams, F. C. 2008, ApJ, 675, 1361 [NASA ADS] [CrossRef] [Google Scholar]
- Gautier, D., & Hersant, F. 2005, Space Sci. Rev., 116, 25 [NASA ADS] [CrossRef] [Google Scholar]
- Giacalone, S., Teitler, S., Königl, A., Krijt, S., & Ciesla, F. J. 2019, ApJ, 882, 33 [NASA ADS] [CrossRef] [Google Scholar]
- Güdel, M., Briggs, K. R., Arzner, K., et al. 2007, A&A, 468, 353 [Google Scholar]
- Guillot, T. 2022, Exp. Astron., 54, 1027 [NASA ADS] [CrossRef] [Google Scholar]
- Guillot, T., & Hueso, R. 2006, MNRAS, 367, L47 [CrossRef] [Google Scholar]
- Guillot, T., Fletcher, L. N., Helled, R., et al. 2023, in Astronomical Society of the Pacific Conference Series, 534, Protostars and Planets VII, eds. S. Inutsuka, Y. Aikawa, T. Muto, K. Tomida, & M. Tamura, 947 [Google Scholar]
- Gundlach, B., Kilias, S., Beitz, E., & Blum, J. 2011, Icarus, 214, 717 [Google Scholar]
- Gundlach, B., Schmidt, K. P., Kreuzig, C., et al. 2018, MNRAS, 479, 1273 [NASA ADS] [CrossRef] [Google Scholar]
- Haisch, Karl E., J., Lada, E. A., & Lada, C. J. 2001, ApJ, 553, L153 [Google Scholar]
- Haworth, T. J., Coleman, G. A. L., Qiao, L., Sellek, A. D., & Askari, K. 2023, MNRAS, 526, 4315 [NASA ADS] [CrossRef] [Google Scholar]
- He, J., Acharyya, K., & Vidali, G. 2016, ApJ, 823, 56 [Google Scholar]
- Hofstadter, M., Helled, R., Stevenson, D. J., et al. 2024, arXiv e-prints [arXiv:2412.01872] [Google Scholar]
- Howard, S., Guillot, T., Markham, S., et al. 2023, A&A, 680, L2 [Google Scholar]
- Howard, S., Müller, S., & Helled, R. 2024, A&A, 689, A15 [NASA ADS] [CrossRef] [EDP Sciences] [Google Scholar]
- Hu, Z., & Bai, X.-N. 2021, MNRAS, 503, 162 [Google Scholar]
- Hueso, R., & Guillot, T. 2005, A&A, 442, 703 [NASA ADS] [CrossRef] [EDP Sciences] [Google Scholar]
- Ishizaki, L., Tachibana, S., Okamoto, T., Yamamoto, D., & Ida, S. 2023, ApJ, 957, 47 [NASA ADS] [CrossRef] [Google Scholar]
- Johansen, A., Blum, J., Tanaka, H., et al. 2014, in Protostars and Planets VI, eds. H. Beuther, R. S. Klessen, C. P. Dullemond, & T. Henning, 547 [Google Scholar]
- Kruijer, T. S., Burkhardt, C., Budde, G., & Kleine, T. 2017, PNAS, 114, 6712 [NASA ADS] [CrossRef] [Google Scholar]
- Kunitomo, M., Suzuki, T. K., & Inutsuka, S.-i. 2020, MNRAS, 492, 3849 [NASA ADS] [CrossRef] [Google Scholar]
- Kunitomo, M., Ida, S., Takeuchi, T., et al. 2021, ApJ, 909, 109 [NASA ADS] [CrossRef] [Google Scholar]
- Lee, Y.-N., Charnoz, S., & Hennebelle, P. 2021, A&A, 648, A101 [NASA ADS] [CrossRef] [EDP Sciences] [Google Scholar]
- Ligterink, N. F. W., & Minissale, M. 2023, A&A, 676, A80 [NASA ADS] [CrossRef] [EDP Sciences] [Google Scholar]
- Ligterink, N. F. W., Kipfer, K. A., & Gavino, S. 2024a, A&A, 687, A224 [NASA ADS] [CrossRef] [EDP Sciences] [Google Scholar]
- Ligterink, N. F. W., Kipfer, K. A., Rubin, M., et al. 2024b, A&A, 687, A78 [NASA ADS] [CrossRef] [EDP Sciences] [Google Scholar]
- Lim, J., Simon, J. B., Li, R., et al. 2024, ApJ, 969, 130 [NASA ADS] [CrossRef] [Google Scholar]
- Lunine, J. I., & Stevenson, D. J. 1985, ApJS, 58, 493 [NASA ADS] [CrossRef] [Google Scholar]
- Mahaffy, P. R., Niemann, H. B., Alpert, A., et al. 2000, J. Geophys. Res., 105, 15061 [Google Scholar]
- Marschall, R., & Morbidelli, A. 2023, A&A, 677, A136 [NASA ADS] [CrossRef] [EDP Sciences] [Google Scholar]
- Marty, B., Altwegg, K., Balsiger, H., et al. 2017, Science, 356, 1069 [NASA ADS] [CrossRef] [Google Scholar]
- Mizuno, H. 1980, Prog. Theor. Phys., 64, 544 [Google Scholar]
- Monga, N., & Desch, S. 2015, ApJ, 798, 9 [Google Scholar]
- Morbidelli, A., & Nesvorny, D. 2012, A&A, 546, A18 [NASA ADS] [CrossRef] [EDP Sciences] [Google Scholar]
- Morbidelli, A., Baillié, K., Batygin, K., et al. 2022, Nat. Astron., 6, 72 [Google Scholar]
- Morbidelli, A., Marrocchi, Y., Ali Ahmad, A., et al. 2024, A&A, 691, A147 [NASA ADS] [CrossRef] [EDP Sciences] [Google Scholar]
- Mousis, O., Ronnet, T., & Lunine, J. I. 2019, ApJ, 875, 9 [NASA ADS] [CrossRef] [Google Scholar]
- Mousis, O., Lunine, J. I., & Aguichine, A. 2021, ApJ, 918, L23 [NASA ADS] [CrossRef] [Google Scholar]
- Mousis, O., Atkinson, D. H., Ambrosi, R., et al. 2022, Exp. Astron., 54, 975 [Google Scholar]
- Musiolik, G., & Wurm, G. 2019, ApJ, 873, 58 [NASA ADS] [CrossRef] [Google Scholar]
- Nakatani, R., Hosokawa, T., Yoshida, N., Nomura, H., & Kuiper, R. 2018a, ApJ, 857, 57 [NASA ADS] [CrossRef] [Google Scholar]
- Nakatani, R., Hosokawa, T., Yoshida, N., Nomura, H., & Kuiper, R. 2018b, ApJ, 865, 75 [Google Scholar]
- Nakatani, R., Kobayashi, H., Kuiper, R., Nomura, H., & Aikawa, Y. 2021, ApJ, 915, 90 [NASA ADS] [CrossRef] [Google Scholar]
- Nanne, J. A. M., Nimmo, F., Cuzzi, J. N., & Kleine, T. 2019, Earth Planet. Sci. Lett., 511, 44 [CrossRef] [Google Scholar]
- Öberg, K. I., & Wordsworth, R. 2019, AJ, 158, 194 [Google Scholar]
- Ohno, K., & Ueda, T. 2021, A&A, 651, L2 [NASA ADS] [CrossRef] [EDP Sciences] [Google Scholar]
- Owen, T., Mahaffy, P., Niemann, H. B., et al. 1999, Nature, 402, 269 [Google Scholar]
- Picogna, G., Ercolano, B., & Espaillat, C. C. 2021, MNRAS, 508, 3611 [NASA ADS] [CrossRef] [Google Scholar]
- Pineda, J. E., Segura-Cox, D., Caselli, P., et al. 2020, Nat. Astron., 4, 1158 [NASA ADS] [CrossRef] [Google Scholar]
- Pollack, J. B., Hubickyj, O., Bodenheimer, P., et al. 1996, Icarus, 124, 62 [NASA ADS] [CrossRef] [Google Scholar]
- Redhead, P. A. 1962, Vacuum, 12, 203 [CrossRef] [Google Scholar]
- Schneeberger, A., Mousis, O., Aguichine, A., & Lunine, J. I. 2023, A&A, 670, A28 [NASA ADS] [CrossRef] [EDP Sciences] [Google Scholar]
- Schoonenberg, D., Ormel, C. W., & Krijt, S. 2018, A&A, 620, A134 [NASA ADS] [CrossRef] [EDP Sciences] [Google Scholar]
- Schräpler, R. R., Landeck, W. A., & Blum, J. 2022, MNRAS, 509, 5641 [Google Scholar]
- Sellek, A. D., Booth, R. A., & Clarke, C. J. 2020, MNRAS, 492, 1279 [NASA ADS] [CrossRef] [Google Scholar]
- Sellek, A. D., Grassi, T., Picogna, G., et al. 2024, A&A, 690, A296 [NASA ADS] [CrossRef] [EDP Sciences] [Google Scholar]
- Shu, F. H. 1977, ApJ, 214, 488 [Google Scholar]
- Smith, R. S., Matthiesen, J., Knox, J., & Kay, B. D. 2011, J. Phys. Chem. A, 115, 5908 [Google Scholar]
- Smith, R. S., May, R. A., & Kay, B. D. 2016, J. Phys. Chem. B, 120, 1979 [Google Scholar]
- Sugiura, N., & Fujiya, W. 2014, Meteor. Planet. Sci., 49, 772 [CrossRef] [Google Scholar]
- Suzuki, T. K., Ogihara, M., Morbidelli, A., Crida, A., & Guillot, T. 2016, A&A, 596, A74 [NASA ADS] [CrossRef] [EDP Sciences] [Google Scholar]
- Takasao, S., Tomida, K., Iwasaki, K., & Suzuki, T. K. 2018, ApJ, 857, 4 [NASA ADS] [CrossRef] [Google Scholar]
- Tanaka, H., Murase, K., & Tanigawa, T. 2020, ApJ, 891, 143 [NASA ADS] [CrossRef] [Google Scholar]
- Tielens, A. 2008, Annu. Rev. Astron. Astrophys., 46, 289 [CrossRef] [Google Scholar]
- Ueda, T., Flock, M., & Okuzumi, S. 2019, ApJ, 871, 10 [Google Scholar]
- Valdivia-Mena, M. T., Pineda, J. E., Segura-Cox, D. M., et al. 2022, A&A, 667, A12 [NASA ADS] [CrossRef] [EDP Sciences] [Google Scholar]
- Villeneuve, J., Chaussidon, M., & Libourel, G. 2009, Science, 325, 985 [Google Scholar]
- Wada, K., Tanaka, H., Suyama, T., Kimura, H., & Yamamoto, T. 2011, ApJ, 737, 36 [CrossRef] [Google Scholar]
- Wolfire, M. G., McKee, C. F., Hollenbach, D., & Tielens, A. G. G. M. 2003, ApJ, 587, 278 [Google Scholar]
- Youdin, A. N., & Goodman, J. 2005, ApJ, 620, 459 [Google Scholar]
- Zhu, Z., Stone, J. M., & Bai, X.-N. 2015, ApJ, 801, 81 [NASA ADS] [CrossRef] [Google Scholar]
- Zsom, A., Sándor, Z., & Dullemond, C. P. 2011, A&A, 527, A10 [NASA ADS] [CrossRef] [EDP Sciences] [Google Scholar]
This definition corresponds to half of the value given by Eq. (2) of Birnstiel et al. (2012). Since we calculate the maximum dust size, sdust, using this equation from the maximum Stokes number (Section 2.2.2), the difference reduces the small dust population, such as ƒent, by a factor of 0.7. However, this is not expected to affect our results, since sdust is more than one order of magnitude larger than 1 µm, except near the disk edge.
Ishizaki et al. (2023) did not test the availability of their estimation for the reaction occurring at T < 150 K.
Appendix A Shu centrifugal radius model
Shu (1977) estimated the centrifugal radius of isothermal spheres,
 (A.1)
(A.1)
where ωcd and Tcd are the angular velocity and temperature of the molecular cloud. As the centrifugal radius given by Shu (1977) is larger than that given by Morbidelli et al. (2022), this model can carry more materials, including the noble gases, to the outer disk region (Marschall & Morbidelli 2023). Thus, this centrifugal radius is expected to enable the higher enrichments of noble gases. However, as shown in Table A.1, the trend that the lower luminosity is required to reproduce noble gas enrichment with Edes from SMK2016 does not change. On the other hand, Edes from L+2024 also can show the noble gas enrichment with the Shu disk model (Table A.2). As Shu centrifugal radius model can carry more solids and noble gases to the outer disk region, the noble gas enrichment increases more than the centrifugal radius model given by Morbidelli et al. (2022). This trend also appears when we assume release of noble gas species through H2O crystallization (Table A.3).
Appendix B Estimation of desorption temperature of noble gases
When we define the fraction of noble gas species that exist in the gas phase xi,gas as xi,gas = ni,gas/ni,tot, the condensation rate can be rewritten as
 (B.1)
(B.1)
Similarly, the sublimation rate can be rewritten as
 (B.2)
(B.2)
Equaling Eqs. (B.1) and (B.2), the fraction xi,gas is given by
 (B.3)
(B.3)
When we define the desorption temperature, Tdes as the temperature when xi,gas = 0.5, Tdes is estimated to be
![Mathematical equation: $\eqalign{ & {T_{{\rm{des}}}} = {E_{{\rm{des}}}}\,[\ln \,{\nu _i} - \ln \,{n_{{\rm{dust}}}} - 0.5\,\ln \,T - 2\,\ln \,{s_{{\rm{dust}}}} \cr & \,\,\,\,\,\,\,\,\,\,\,\,\,\,\,\,\,\,\,\,\, + 0.5\,\ln \,{\mu _i} - 11{]^{ - 1}}. \cr} $](/articles/aa/full_html/2025/11/aa55204-25/aa55204-25-eq70.png) (B.4)
(B.4)
The dust number density ndust is given by
 (B.5)
(B.5)
where Hd is the dust scale height. Although the lower Schmidt number contributes to the dust settling and the lower dust scale height, we here ignore the factor of the lower dust scale height because the scale height is unlikely to change the order of magnitude of the dust number density, ndust, by more than 2. As the irradiation temperature is estimated to be T ~ 50 (L*/1L⊙)2/7(r/8 au)−3/7 K in the passive disk (Chiang & Goldreich 1997), the total number density is rewritten in
 (B.6)
(B.6)
Therefore, the desorption temperature is estimated to be
![Mathematical equation: ${T_{{\rm{des}}}}\~18\left( {{{{E_{{\rm{des}}}}} \over {860\,{\rm{K}}}}} \right){\left[ {1 - 0.073\,\ln \left( {{T \over {18\,{\rm{K}}}}} \right) + {C_1}} \right]^{ - 1}}\,{\rm{K,}}$](/articles/aa/full_html/2025/11/aa55204-25/aa55204-25-eq73.png) (B.7)
(B.7)
where
![Mathematical equation: $\eqalign{ & {C_1} = 0.021[\ln \left( {{{{\nu _1}} \over {{{10}^{12}}\,{{\rm{s}}^{ - 1}}}}} \right) - \ln \left( {{{{\Sigma _{\rm{d}}}/{\Sigma _{\rm{g}}}} \over {{{10}^{ - 2}}}}} \right) - \ln \left( {{{{\Sigma _{\rm{g}}}} \over {1\,{\rm{g/c}}{{\rm{m}}^2}}}} \right) \cr & \,\,\,\,\,\,\,\,\,\,\,\,\, + \ln \left( {{{{s_{{\rm{dust}}}}} \over {1\,\mu {\rm{m}}}}} \right) + \ln \left( {{{{L_*}} \over {1\,{L_ \odot }}}} \right) + 0.5\,\ln \left( {{{{\mu _i}} \over {36}}} \right)], \cr} $](/articles/aa/full_html/2025/11/aa55204-25/aa55204-25-eq74.png) (B.8)
(B.8)
This equation for the temperature is not analytically solvable. However, the dependency on the disk temperature on the right-hand side is negligible compared to that on the desorption energy. Thus, we roughly estimate the desorption temperature as
![Mathematical equation: ${T_{\rm{1}}}\~18\left( {{{{E_{{\rm{des}}}}} \over {860\,{\rm{K}}}}} \right){\left[ {1 + {C_1}} \right]^{ - 1}}\,{\rm{K,}}$](/articles/aa/full_html/2025/11/aa55204-25/aa55204-25-eq75.png) (B.9)
(B.9)
and obtain the final estimation as
![Mathematical equation: ${T_{{\rm{des,1}}}}\~18\left( {{{{E_{{\rm{des}}}}} \over {860\,{\rm{K}}}}} \right){\left[ {1 - 0.073\,\ln \left( {{{{T_1}} \over {18\,{\rm{K}}}}} \right) + {C_1}} \right]^{ - 1}}\,{\rm{K}}$](/articles/aa/full_html/2025/11/aa55204-25/aa55204-25-eq76.png) (B.10)
(B.10)
The desorption temperature when the noble gas species cover the dust surface is similarly estimated to be
![Mathematical equation: ${T_{{\rm{des}}}} = {E_{{\rm{des}}}}{\left[ {\ln \,{\nu _i} - \ln \,{n_{i,{\rm{tot}}}} - 0.5\ln \,{T_2} + 0.5\,\ln \,{\mu _i} + 27} \right]^{ - 1}}.$](/articles/aa/full_html/2025/11/aa55204-25/aa55204-25-eq77.png) (B.11)
(B.11)
As the total number density of noble gas species ni,tot is given by
 (B.12)
the desorption temperature is estimated to be
![Mathematical equation: ${T_{{\rm{des,2}}}}\~18\left( {{{{E_{{\rm{des}}}}} \over {860\,{\rm{K}}}}} \right){\left[ {1 - 0.074\,\ln \left( {{{{T_2}} \over {18\,{\rm{K}}}}} \right) + {C_2}} \right]^{ - 1}}\,{\rm{K,}}$](/articles/aa/full_html/2025/11/aa55204-25/aa55204-25-eq79.png) (B.13)
(B.13)
where
![Mathematical equation: ${T_{\rm{2}}}\~18\left( {{{{E_{{\rm{des}}}}} \over {860\,{\rm{K}}}}} \right){\left[ {1 + {C_2}} \right]^{ - 1}}\,{\rm{K,}}$](/articles/aa/full_html/2025/11/aa55204-25/aa55204-25-eq80.png) (B.14)
(B.14)
and
![Mathematical equation: $\eqalign{ & {C_{\rm{2}}} = 0.021[ln\left( {{{{\nu _i}} \over {{{10}^{12}}\,{{\rm{s}}^{ - 1}}}}} \right) - ln\left( {{{{n_{i,\,{\rm{tot}}}}/{n_{\rm{H}}}} \over {{{10}^{ - 6}}}}} \right) \cr & \,\,\,\,\,\,\,\,\,\,\,\,\,\,\,\,\,\,\,\,\,\, - ln\left( {{{{\Sigma _{\rm{g}}}} \over {1\,{\rm{g/c}}{{\rm{m}}^2}}}} \right) + ln\left( {{{{L_*}} \over {1\,{L_ \odot }}}} \right) + 0.5\left( {{{{\mu _i}} \over {36}}} \right)]. \cr} $](/articles/aa/full_html/2025/11/aa55204-25/aa55204-25-eq81.png) (B.15)
(B.15)
Appendix C Condensation rate with the dust size distribution
In this study, we consider the single maximum dust size to calculate the condensation rate, Rcond. However, when the dust size follows a given distribution, the surface area can be on the minimum dust size. However, as shown below, the contribution of the dust size to the desorption temperature is much lower than the desorption energy.
The total dust surface area in [r, r + ∆r], Sd,tot with a single dust size is given by
 (C.1)
(C.1)
On the other hand, when the dust size distribution is given by dN ∝ s−3.5ds, the total surface area is given by
 (C.2)
(C.2)
where smin is the minimum dust size. Considering the size distribution, the total surface area is multiplied by  . Thus, the estimated desorption temperature is rewritten by
![Mathematical equation: ${T'_{{\rm{des,1}}}}\~19\left( {{{{E_{{\rm{des}}}}} \over {860\,{\rm{K}}}}} \right){\left[ {1 - 0.077\left( {{{{{T'}_{\rm{1}}}} \over {19\,{\rm{K}}}}} \right) + {{C'}_1}} \right]^{ - 1}}\,{\rm{K,}}$](/articles/aa/full_html/2025/11/aa55204-25/aa55204-25-eq85.png) (C.3)
(C.3)
where
![Mathematical equation: ${T'_{\rm{1}}}\~19\left( {{{{E_{{\rm{des}}}}} \over {860\,{\rm{K}}}}} \right){\left[ {1 + {{C'}_1}} \right]^{ - 1}}\,{\rm{K,}}$](/articles/aa/full_html/2025/11/aa55204-25/aa55204-25-eq86.png) (C.4)
(C.4)
and
![Mathematical equation: $\eqalign{ & {{C'}_{\rm{1}}} = 0.022[ln\,\left( {{{{\nu _i}} \over {{{10}^{12}}\,{{\rm{s}}^{ - 1}}}}} \right) - ln\left( {{{{\Sigma _{\rm{d}}}/{\Sigma _{\rm{g}}}} \over {{{10}^{ - 2}}}}} \right) - ln\left( {{{{\Sigma _{\rm{g}}}} \over {1\,{\rm{g/c}}{{\rm{m}}^2}}}} \right) \cr & \,\,\,\,\,\,\,\,\,\, + 0.5\,ln\,\left( {{{{s_{{\rm{dust}}}}} \over {1\,\mu {\rm{m}}}}} \right) + 0.5\,ln\,\left( {{{{s_{{\rm{min}}}}} \over {0.01\,\mu {\rm{m}}}}} \right) + ln\,\left( {{{{L_*}} \over {1\,{L_ \odot }}}} \right) + 0.5\,ln\,\left( {{{{\mu _i}} \over {36}}} \right)]. \cr} $](/articles/aa/full_html/2025/11/aa55204-25/aa55204-25-eq87.png) (C.5)
(C.5)
As shown by this estimation, the desorption temperature cannot be influenced by the smaller dust as far as the minimum size is in the order of 0.01 µm.
All Tables
Noble gas enrichment in Jovian atmosphere with desorption via H2O crystallization.
Starting timing of gas accretion and noble gas enrichment in the Jovian atmosphere when eJup = 0.8.
All Figures
|
Fig. 1 Disk properties for No. S13 parameter sets: L* = L⊙, α0 = 0.04. Sc= 1.0, ƒIPE = 0.1, FUV = 10 G0, and ƒvfrag is on. |
| In the text | |
|
Fig. 2 Enrichment of noble gases not frozen on the dust surface, compared to their solar abundances in a protoplanetary disk for the sun-like stellar luminosity (upper row) and the lower stellar luminosity (lower row). The left, center, and right columns show the Ar, Kr, and Xe enrichment. The white solid vertical and horizontal lines show the positions of current Jupiter (5.2 au) and the timing of the Jovian core starting the gas accretion, tstart. The white dotted and dashed lines show the disk edge, rdisk, and the ice lines, rAr, rKr, and rXe. The dashed-dotted lines indicate the radii where the gas velocity is converted to outward, |
| In the text | |
|
Fig. 3 Xe abundance with temperature-dependent fragmentation velocity (No. S8) and the constant fragmentation velocity for ice (No. S9). The parameters except for ƒvfrag are L*, = L⊙, α0 = 0.01, FUV = 10 G0, Sc = 0.1, and ƒIPE = 0.25. |
| In the text | |
|
Fig. 4 Ratio of the mass and enrichment for case no. S8 (ƒvfrag : on) compared to case no. S9 (ƒvfrag: off). The blue line represents the mass ratio of the gas disk inside the Xe ice line, rXe. The magenta line represents the mass ratio of the dust outside the Xe ice line. The black dashed line represents the ratio of Xe enrichment inside the Xe ice line. |
| In the text | |
|
Fig. 5 Xe abundance for the different Sc values, Sc = 0.1 (No. S12) and Sc = 1.0 (No. S13). The parameters except for Sc are L* = L⊙, α0 = 0.04, FUV = 10 G0, ƒIPE = 0.1, and ƒvfrag is on. |
| In the text | |
|
Fig. 6 Kr enrichment in the disk for different parameter sets. The left, center, and right panels show the results with the parameter sets of No. S1 (FUV =10 G0), S2 (FUV = 103G0), and S3 (FUV = 105 G0). The meanings of the lines are the same as Figure 2. The parameters except for FUV are L* = 0.1 L⊙, α0 = 0.04, ƒIPE = 0.1, and ƒvftag is on. |
| In the text | |
|
Fig. 7 Total mass ratio of Kr to the disk gas for the cases with higher FUV fields compared to the lower FUV field case. The blue and red lines show the Kr mass ratio, which exists in the gas phase and freezes onto the dust surface. The orange line shows the mass ratio of the total amount of Kr to the disk gas. |
| In the text | |
|
Fig. 8 Time evolution of total mass ratio of dust (Md) to gas (Mg) for the different FUV fields. The black, blue, and orange lines indicate the results for FUV = 10 G0, 103 G0, 105 G0. The see-saw pattern is caused by condensation and sublimation of H2O ice, silicates, and refractory materials. |
| In the text | |
|
Fig. 9 Radial velocities of gas and dust at 2 Myr for the different FUV fields. The black, blue, and orange lines indicate the results for FUV = 10 G0, 103 G0, 105 G0. The solid and dashed lines show the radial velocities of dust and gas. The positive value indicates the outward velocity, and the negative value indicates the inward velocity. |
| In the text | |
|
Fig. 10 Xe abundance for the different ƒIPE values: ƒIPE = 0.1 (No. S12) and ƒIPE = 0.25 (No. S11). The parameters for all (apart from ƒIPE) are L* = L⊙, α0 = 0.04, FUV = 10 G0, and ƒvfrag is on. |
| In the text | |
|
Fig. 11 Xe enrichment in the disk for different initial turbulent strengths. The left, center, and right panels show the results with the parameter sets of No. S8 (α0 = 0.01), S11 (α0 = 0.04), and S14(α0 = 0.1). The meanings of the lines are the same as Figure 2. We set tinfall = 6.3 × 10⁴ year to obtain the largest dust disk radius (see Figure 6 in Marschall & Morbidelli 2023). The parameters except for α0 are L* = L⊙, FUV = 10 G0, ƒIPE = 0.1, Sc = 0.1, and ƒvfrag is on. |
| In the text | |
|
Fig. 12 Enrichment of noble gases compared to their solar abundances in a protoplanetary disk for the sun-like stellar luminosity (upper row) and the lower stellar luminosity (lower row) obtained with the desorption parameters from L+2024. The left, center, and right columns show the Ar, Kr, and Xe enrichment. The white solid and dotted lines show the positions of current Jupiter (5.2 au) and disk edge, rdisk. The dashed-dotted lines indicate the radii where the gas velocity is converted to outward, |
| In the text | |
|
Fig. 13 Noble gas abundance in Jovian atmosphere with data from SMK2016 (No. S13) and L+2024 (No. L9). The grey areas show the observational value obtained by Galileo prove (Mahaffy et al. 2000). The disk parameter sets are L* = L⊙, α0 = 0.04, Sc = 1.0, ƒIPE = 0.1, FUV = 10 G0, and ƒvfrag is on. |
| In the text | |
|
Fig. 14 Kr enrichment with two conditions for the desorption via H2O crystallization: (A) noble gases are released only inside rcry and condense only outside their ice lines estimated by SMK2016. (B) Noble gases released at rcry condense and sublimate at their ice lines estimated by SMK2016. The disk parameters are the same as No. S13. |
| In the text | |
Current usage metrics show cumulative count of Article Views (full-text article views including HTML views, PDF and ePub downloads, according to the available data) and Abstracts Views on Vision4Press platform.
Data correspond to usage on the plateform after 2015. The current usage metrics is available 48-96 hours after online publication and is updated daily on week days.
Initial download of the metrics may take a while.